

Most teams know this feeling. Signups climb. The ad dashboard looks healthy. Yet, repeat usage and renewals barely move. New people walk in through the front door while existing customers quietly leave through the back.
A product growth strategy gives you a structured way to find out where the growth is actually stuck. Sustainable growth rarely comes from more paid ads, more new features or bigger signup numbers on their own. It comes from five levers working together. Customer acquisition. Activation. Retention. Monetization. Referrals.
This guide walks you through a diagnostic framework for finding your weakest lever. These are nine practical strategies for fixing it, the growth metrics worth tracking, two real company examples and a 30-day plan. Take what fits your product. Leave the rest.
Table of Contents
What Is a Product Growth Strategy?
A product growth strategy is a structured plan for increasing a product’s adoption, customer value, retention, and revenue. It ties together four things teams often handle separately: what customers need, how the product is positioned, which channels bring people in, and what the user experience feels like once they arrive.
In plain terms, it answers one question. Where should you put your growth efforts first?
The answer changes from product to product. A project management tool for agencies and a payments app for first-time investors can’t borrow each other’s playbook, even when both teams want business growth.
Product Strategy vs. Product Growth Strategy
Product strategy decides what the product should achieve and for whom. It covers the vision, the target market and the product roadmap. A product growth strategy picks up from there and works out how that product wins adoption, usage, and commercial success. One sets the destination. The other plans the route.
Business strategy has made this split for decades. Igor Ansoff’s growth matrix got introduced in a 1957 Harvard Business Review article. It separates market development (selling existing products to new markets) from product development (building new products for existing markets). Same company, different growth approach.
Also Read: How to Build a Product Marketing Framework from Scratch: Step-by-Step Guide
When Does a Business Need a Product Growth Strategy?
Usually when the symptoms pile up. Acquisition costs keep rising. Retention is weak, so you’re refilling a leaky bucket. Onboarding confuses people enough that they sign up and vanish. Few free users turn into paying ones. New features ship with no agreed definition of success.
One or two of these is normal. Four or five means you’re guessing, and a growth strategy replaces the guessing with evidence.
Product-Led Growth vs. Sales-Led and Marketing-Led Growth
Product-led growth (PLG) is one way to grow a product. It isn’t a synonym for a product growth strategy. Plenty of sound strategies don’t use it at all.
PLG is a go-to-market approach where the product itself drives customer acquisition, activation, retention, and expansion. According to Mixpanel’s 2026 guide, Blake Bartlett of OpenView Venture Capital coined the term in 2016. The same guide cites ProductLed’s benchmarks. That puts the share of companies using a PLG model at 58%.
Product-led growth (PLG) is a go-to-market approach where the product itself drives customer acquisition, activation, retention, and expansion. It is one growth model among several. It is not a replacement for a broader product growth strategy. Mixpanel’s 2026 guide, citing ProductLed benchmarks, reports that 58% of companies use a PLG model.
How Product-Led, Sales-Led, and Marketing-Led Growth Differ
Sales-led growth relies on a sales team to find, pitch and close customers. Marketing-led growth relies on marketing strategies like campaigns, content, and events to create demand first. Product-led growth lets the product do much of that work.
| Product-led | Sales-led | Marketing-led | |
| Main way customers arrive | Free access, trials, sharing, in-product invites | Conversations run by a sales team | Marketing campaigns across content, ads, events, and email |
| Buying experience | Self-serve: try first, pay later | Guided: demos, proposals, procurement | Mixed: campaign interest becomes a signup or demo request |
| Time to value | Minutes to days | Often weeks to months after the deal | Depends on onboarding after signup |
| Role of the product | Main driver of acquisition and conversion | Supports the pitch through demos | Delivers on what the campaigns promised |
| Suitable business models | Easy-to-adopt software with a low entry price | Complex, high-value products with many decision makers | Broad-market products where awareness is the bottleneck |
When Does a Product-Led Approach Make Sense?
When a person can judge the product’s value alone, and fast. That usually means self-service access. A free experience that’s genuinely useful. Features that pull other people in. Onboarding short enough to finish in one sitting. Many SaaS companies fit this pattern because software can be tried instantly. If your product needs weeks of setup before it shows anything, PLG gets much harder.
Why Hybrid Growth Models Can Work Better
Most teams don’t pick one model. They mix them. Mixpanel’s guide describes a hybrid called product-led sales, where product usage data flags accounts showing buying intent and the sales team steps in at that moment. Plenty of teams run PLG strategies this way, with marketing efforts bringing people in and customer success keeping them there.
The payoff is that marketing and sales teams work from the same signals instead of arguing over credit.
Also Read: Product Marketing Fundamentals: How to Build a Winning Strategy
The Five Core Levers of Product Growth
Every product grows through the same five levers that drive growth. What differs is which one is holding yours back.
1. Customer Acquisition
Bringing in qualified prospects through relevant channels, useful content, partnerships and clear positioning. The word that matters is “qualified.”
2. Activation and Product Adoption
Helping new users reach a first meaningful outcome and understand the product value.
3. Retention and Engagement
Giving customers regular reasons to come back by delivering value consistently.
4. Monetization and Customer Expansion
Turning the right users into paying customers. Growing revenue from existing customers where that makes sense.
5. Referrals and Organic Distribution
Letting discovery spread through useful sharing, integrations, advocacy and referral mechanisms.
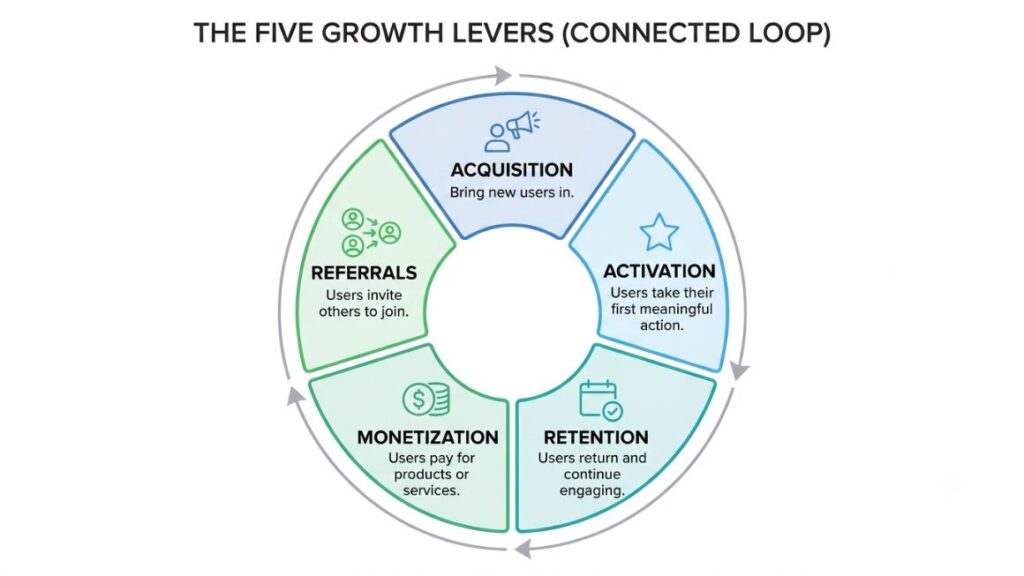
These levers connect. But don’t try to improve all five at once. Teams that do end up with five half-finished projects and no clear result. The next section shows how to find the one constraint worth fixing first.
How to Diagnose Your Product’s Biggest Growth Bottleneck?
Start with evidence, not a favorite tactic. These five steps point you to the one lever that deserves attention right now.
Step 1: Define Your Target Customer and Core Value
Write down:
- Who is this product for?
- Which problem does it solve?
- What outcome do those customers expect?
If your team gives three different answers, fix that first.
Step 2: Map the Customer Journey
Sketch the user journey from discovery to signup, activation, repeat usage, payment, and renewal, wherever those apply. Mark the points where people drop off or never see value. A funnel chart helps. Though a whiteboard works too.
Step 3: Examine Activation and Retention Data
Check whether new users complete a first-value action. See whether they return at the pace your product naturally calls for. Pair product analytics with customer interviews and user feedback. Numbers show what happened. Conversations explain why.
Step 4: Identify the Main Growth Constraint
Look at where the evidence points most strongly: acquisition quality, activation, retention, monetization or referrals.
Step 5: Prioritize One Improvement
Prioritize by potential impact, confidence in the evidence, effort and fit with business goals. Then choose one. Just one.
| Observed problem | Potential area to investigate |
| High traffic, few qualified signups | Positioning, audience fit, and conversion |
| Many signups, little meaningful product use | Onboarding and activation |
| Strong initial usage, weak repeat usage | Retention and ongoing customer value |
| Healthy usage, weak paid conversion | Pricing, packaging, and perceived value |
| Satisfied customers, limited referrals | Sharing opportunities and advocacy |
Read this table as a list of hypotheses, not diagnoses. A drop in signups might be a pricing problem, a tracking bug or a weak campaign. Validate each guess with product data and customer research before you commit people and budget.
A growth bottleneck is the single lever (acquisition, activation, retention, monetization, or referrals) where evidence shows the biggest loss of customer value. Teams find it by mapping the customer journey, checking activation and retention data and prioritizing one improvement at a time.
Nine Practical Product Growth Strategies
These nine tactics are the main ways teams act on a diagnosis. Several are classic product-led growth strategies, and others work just as well in sales-led setups. Match one to your bottleneck and set the rest aside for now.
1. Choose the Right Free Trial or Freemium Model
- When to use it: Customers need hands-on time with the product before they can judge it.
- How it works: Pick a time-limited free trial when the product shows value quickly and costs real money to serve. Pick a freemium model, an ongoing free tier, when habits build slowly or wider use spreads the product. The cost of serving free users sets the limits of any freemium strategy.
- What to measure: Trial-to-paid conversion rate, free-to-paid conversion, customer quality, and acquisition economics.
2. Optimize Onboarding for Faster Time to Value
- When to use it: New users sign up but never reach a useful first result.
- How it works: Cut setup steps, offer templates that match the user’s job, and steer people toward one valuable first action. Every extra form field before that moment costs you users.
What to measure: Activation rate, time to value, onboarding completion, and retention in the following weeks.
Also Read: 15 Customer Onboarding Software That Boost Retention Fast
3. Build Useful Product-Driven Sharing Loops
- When to use it: The product involves collaboration, invitations, shared outputs, or work with other people.
- How it works: Make sharing part of getting the job done, not a pop-up begging for favors. A growth loop is a cycle where one user’s activity brings in the next user. Viral growth, where each user brings in more than one new user, is rare, but even a smaller loop lowers acquisition cost.
- What to measure: Invitations sent, recipient-to-signup conversion, activation of invited users, and their retention.
4. Use Content Marketing and SEO to Attract Qualified Customers
- When to use it: Potential customers search for answers, use cases, or comparisons before buying.
- How it works: Publish educational pages, comparison pages, and use-case guides that answer questions at each stage of the buying journey. This builds organic growth that doesn’t depend on ad spend.
- What to measure: Qualified organic traffic, conversion to signup or trial, and customers acquired through organic search where you can trace them.
Also Read: Content Marketing Strategy: The Complete Guide (2026)
5. Build a Customer Community Where It Adds Value
- When to use it: Customers learn from each other or share expertise around the product.
- How it works: Create a space where people ask questions, swap tips, and give feedback. If there’s nothing worth discussing, skip it. An empty forum hurts more than no forum.
- What to measure: Meaningful participation, repeat engagement, quality of feedback, and retention among members. Engaged customers are the ones who join, so treat this as a signal, not proof.
6. Run Structured Growth Experiments
- When to use it: You have a clear hypothesis but can’t tell which change will work.
- How it works: Before launch, write down the hypothesis, primary metric, test conditions, decision rule, and guardrails (metrics that must not get worse). Growth product teams then feed each result into a feedback loop that shapes the next test.
- What to measure: The primary metric, secondary metrics, and whether the evidence is solid enough to act on.
7. Develop Strategic Partnerships and Integrations
- When to use it: Customers already use complementary tools or depend on connected workflows.
- How it works: Build integrations that save people work, or team up with partners who reach the same audience and have a genuine reason to recommend you.
- What to measure: Integration adoption, partner-sourced signups, qualified conversions and retained customers from the channel.
8. Improve Retention Through Customer Education
- When to use it: Customers can’t find features, form useful habits or keep getting value.
- How it works: Add contextual tips, clear documentation, short tutorials and messages timed to what the person is doing. Teaching beats nagging.
- What to measure: Repeat usage, feature adoption where it matters, cohort retention and support requests caused by avoidable confusion.
9. Create Customer Referral Programs
- When to use it: Happy customers can credibly recommend you and there’s a natural moment to ask.
- How it works: Referral programs leverage trust that already exists. Offer an incentive that fits, place the prompt right after a good experience and make acting on it easy.
- What to measure: Referral participation, referred-user conversion, cost per acquired customer, and the retention and revenue of referred customers.
How to Measure Product Growth: Essential Metrics and Definitions
Growth metrics only help when everyone defines them the same way. A “signup” can mean an email typed into a form or a verified account. That one gap can wreck a quarterly review.
Acquisition Metrics
Qualified traffic is visits from people who match your target customer. Signup conversion rate is signups divided by visitors.
Customer acquisition cost (CAC) is acquisition spend divided by the new customers won in the same period. Decide which costs count, such as ad spend, sales and marketing salaries, and tools, then keep that scope constant. CAC isn’t cost per lead, cost per signup, or cost per acquisition event. Those measure earlier steps. CAC counts customers.
Activation and Time-to-Value Metrics
Activation rate is the percentage of eligible new users who complete a meaningful first-value action within a set period. The event should reflect real value, not account creation. For a scheduling tool, a sensible event might be a first meeting booked through a shared link.
Retention and Engagement Metrics
Retention measures how many users from a defined cohort stay active over a defined period, using a clear activity rule.
Retention rate = (Original cohort users who meet the defined activity criterion at the end of the period ÷ Original cohort users) × 100
Match the period to how often people naturally use the product: weekly for a daily tool, monthly for an invoicing app. Meaningful engagement means useful product usage, not just logins or time spent. Churn rate is the flip side. It is the share of customers or users who leave in a period.
Monetization and Growth Efficiency Metrics
Paid conversion rate shows how many eligible free or trial users become paying customers. Recurring revenue tracks predictable income, and expansion revenue tracks extra income from existing customers through upgrades, seats, or add-ons. Gross margin, where it applies, shows what’s left after serving customers.
Customer lifetime value, the revenue or gross profit a customer brings over the whole relationship, only means something next to CAC. Growth that costs more than it returns isn’t growth.
Referral Metrics
Track referral participation (how many customers actually refer anyone), referred-user conversion, and the quality and retention of the customers they bring.
Product Growth Metrics Cheat Sheet
| Metric | Definition or formula | When it is useful |
| Signup conversion rate | Signups ÷ visitors × 100 | Spotting weak landing pages or positioning |
| Customer acquisition cost | Acquisition spend ÷ new customers in the same period | Judging channel efficiency |
| Activation rate | Eligible new users completing the first-value action in the period ÷ eligible new users × 100 | Testing onboarding changes |
| Retention rate | Cohort users still active at period end ÷ original cohort × 100 | Checking whether value lasts |
| Churn rate | Customers lost in a period ÷ customers at the start × 100 | Tracking losses in subscription products |
| Paid conversion rate | Paying customers ÷ eligible free or trial users × 100 | Reviewing pricing and packaging |
| Expansion revenue | Extra recurring revenue from existing customers | Judging account growth |
| Customer lifetime value | Revenue or gross profit per customer over the relationship | Comparing against CAC |
No single metric works for every product. Pick one primary growth metric that reflects customer value and your business model. Then add a few diagnostic metrics to explain it and guardrails so a gain in one place doesn’t hide a loss in another.
Also Read: 15 Best Product Analytics Tools
Real-World Product Growth Examples and Lessons
Two real-world examples of product-led growth show how a product experience can spread by itself. Neither proves that one feature explains a company’s success. But both show mechanisms worth studying.
Figma: Collaboration as a Discovery Mechanism
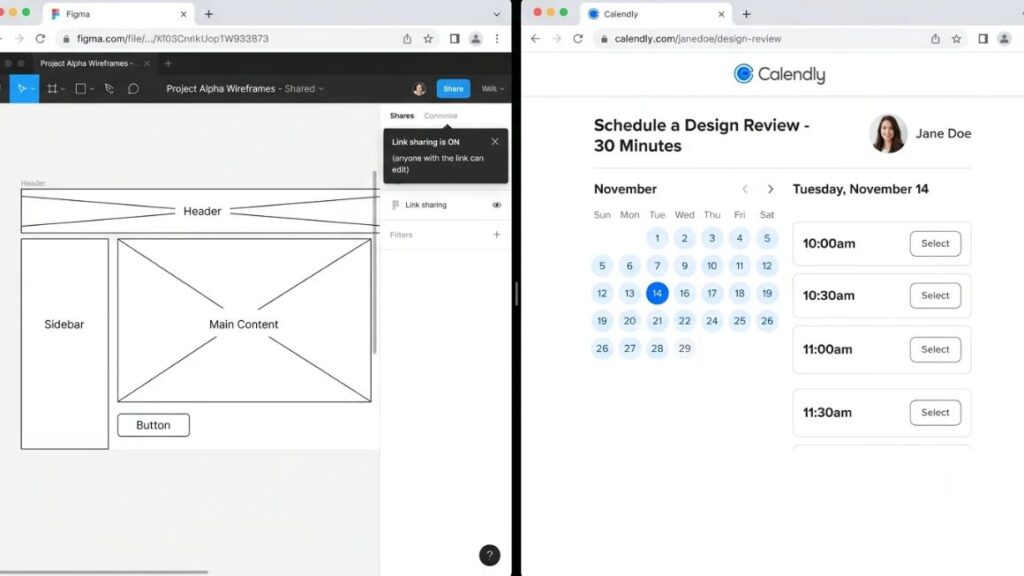
Figma’s design files aren’t only for designers. In its 2025 S-1 filing with the US Securities and Exchange Commission, the company said non-designers including developers, product managers, researchers, marketers, and writers, made up two-thirds of its more than 13 million monthly active users in the three months ended March 31, 2025.
That’s a user base shaped by shared work. When a designer sends a file to a colleague in another role, that colleague meets the product with a real task in front of them. Pricing, product quality, and timing mattered too. So don’t credit collaboration alone.
Calendly: Sharing as Part of the User Experience
Calendly’s booking link does a job for the person who sends it and for the person who receives it. According to a reply from Calendly’s community team, invitees only need an email address to book. They don’t need an account.
So each booked meeting is a small, friction-free encounter with the product. Some invitees may later set up their own link. That’s the loop. How often it happens is something these public facts can’t tell you.
What Businesses Can Learn From These Examples
- Make sharing useful, not forced.
- Cut friction between discovering the product and trying it.
- Measure whether newly exposed users become active customers.
- Adapt the mechanism to your audience and how they use the product.
Successful product-led growth tends to share one trait in both cases: ordinary use of the product introduces it to new people.
Product Growth Strategy Trends to Watch in 2026
Treat everything here as direction, not destiny. Measured findings come first. Interpretation is labeled as such.
AI-Assisted Analytics and Personalization
Teams are using AI to summarize customer feedback, explore usage patterns and tailor experiences. McKinsey’s 2026 State of AI survey, published August 25, 2026, found that 89% of respondents’ organizations regularly use AI in at least one business function. Yet only 37% attribute any EBIT impact to it. Accuracy is a real limit: in McKinsey’s 2025 survey, inaccuracy was the most common negative consequence. It is reported by 30% of respondents. Privacy and quality control matter as well. So product leaders should keep a human checking the output.
Embedded Distribution and Product Ecosystems
Integrations, collaboration and sharing can put a product in front of people who’d never search for it. That’s our reading of the Figma and Calendly examples. It is not a measured trend. So test it on your own product before betting on it.
Retention and Time to Value as Growth Priorities
Mixpanel’s 2026 State of Digital Analytics report draws on more than 12,000 companies and gives whole sections to feature adoption, time to value, and retention. A vendor sets that agenda, so read it as a sign of where analytics buyers are focusing. Still, the logic holds. Helping customers reach an outcome and keep it often pays back more than chasing the next signup.
McKinsey’s 2026 State of AI survey found 89% of organizations use AI in at least one business function. But only 37% report any EBIT impact. For product teams, that gap is a reminder to tie AI features to a defined customer problem and a measurable outcome.
Common Product Growth Mistakes to Avoid
- Scaling acquisition too early. You pay more to fill a leaky bucket. Validate demand and retention first.
- Treating signups as adoption. Count people who reach value instead.
- Copying competitors. Their pricing, audience, and costs aren’t yours.
- Running experiments without decision criteria. Set the rule before the test starts.
- Offering free access without checking the economics. Free users cost money to serve.
- Collecting metrics nobody uses. If a number never changes a decision, stop reporting it.
- Adding AI features with no defined customer problem. That adds cost, not value.
Your 30-Day Product Growth Action Plan
This is an execution schedule, not another round of theory. It assumes you’ve read the diagnostic steps above.
Week 1: Research and Diagnose
Review analytics, speak with customers, map the customer journey and name the most important growth constraint.
Week 2: Prioritize One Initiative
Choose one evidence-based improvement. Assign an owner, write the hypothesis, record the baseline and set success criteria.
Week 3: Implement and Evaluate
Launch the change or experiment. Watch the primary metric, the supporting metrics, and the guardrails.
Week 4: Decide What to Do Next
Document what you found. Then scale it, refine it, repeat it, or stop.
- Define the target customer and growth objective.
- Identify the primary growth constraint.
- Choose one improvement to test.
- Establish baseline metrics and success criteria.
- Assign ownership and a review date.
- Document the outcome and the next decision.
Conclusion
Sustainable growth comes from helping the right customers get more value, and a product growth strategy keeps your team pointed at that. Diagnose the main constraint first. Choose the lever that matches it. Measure the outcome honestly, then decide what to do next. Repeat that cycle and it becomes a growth engine that doesn’t depend on any single campaign.
Here’s one thing to do today. Open your analytics tool and write your activation event in one sentence. If your team can’t agree on it, you’ve found your first project.
If you want to build these skills with structure, YUP’s Product Management course covers growth, analytics, and prioritization step by step. [CTA: YUP Product Management course, link to be inserted]
Frequently Asked Questions
What is a product growth strategy, and when does a business need one?
A product growth strategy is a structured plan for increasing adoption, retention and revenue from a product. A business needs one when acquisition costs rise, retention stays weak or new features ship without clear success measures.
How do you choose the right product growth strategy?
Start with the bottleneck, not the tactic. Diagnose where users drop out. Then choose the lever and the strategy that match that evidence, whether it’s onboarding, retention or referrals.
How do you create and implement a product growth strategy?
Define your target customer. Map the user journey. Check activation and retention data. Pick one constraint. Then run one initiative with a baseline and a review date. The 30-day plan above lays out the schedule.
What are some examples of effective product growth strategies?
Common ones include free trials or freemium access, onboarding improvements, sharing loops, SEO content, integrations, structured experiments, customer education, and referral programs. Which one is effective depends on your bottleneck.
What is product-led growth, and how does it support product growth?
Product-led growth is a go-to-market approach where the product drives acquisition, activation, retention, and expansion. It supports growth by letting customers try before they buy and by surfacing usage signals teams can act on. For deeper reading, Product School’s PLG resources are a good starting point.
Why is a product growth strategy important?
Without one, teams default to chasing signups or shipping features that don’t move usage. A strategy ties your effort to evidence and business outcomes, so resources don’t go to the wrong lever.
What Is the Difference Between a Growth Strategy and a Growth Tactic?
A growth strategy is the overall plan: which customers, which constraint, which goal. A growth tactic is one specific action inside that plan, such as redesigning onboarding or launching a referral program.
Which Tools Can Help Measure Product Growth?
Product analytics tools such as Mixpanel and Amplitude offer funnel and retention analysis, and Google Analytics 4 includes funnel and cohort explorations. Features and limits vary by plan, so check each tool’s current documentation before you choose.