

Most teams know how many people visit their product. Far fewer know where those people quietly give up. A product can pull in 10,000 visitors a month and still feel stuck, because the problem isn’t traffic. It’s somewhere between the landing page and the first payment, in a step nobody is watching.
That’s the gap product funnel analysis fills. It tracks how users move through the steps that lead to a goal, such as signing up, finishing setup, using the product for the first time and paying, and it shows you exactly where the line gets thin. Total traffic can’t tell you that. A single overall conversion number can’t either.
This guide covers what a product funnel is, how to build and read one in seven steps, which metrics are worth your attention, and how to turn a drop-off into a proper experiment. There’s a worked example with numbers, a tool comparison and a list of mistakes that quietly wreck funnel reports. The method is the same whether you run a SaaS product, an online store or a content platform. Find the leak first, then decide what to fix.
Table of Contents
What Is Product Funnel Analysis?
Product funnel analysis is the practice of measuring how many users move from one defined step to the next on the way to a goal, and where the rest leave. A funnel is the ordered list of those steps. “Our conversion is low” is a feeling. “Four in ten signups never finish setup” is a place to start.
Product funnel analysis measures the share of users who complete each step toward a goal, such as signup, activation or purchase. It shows which step loses the most people. So a team fixes that step first.
How a product funnel works
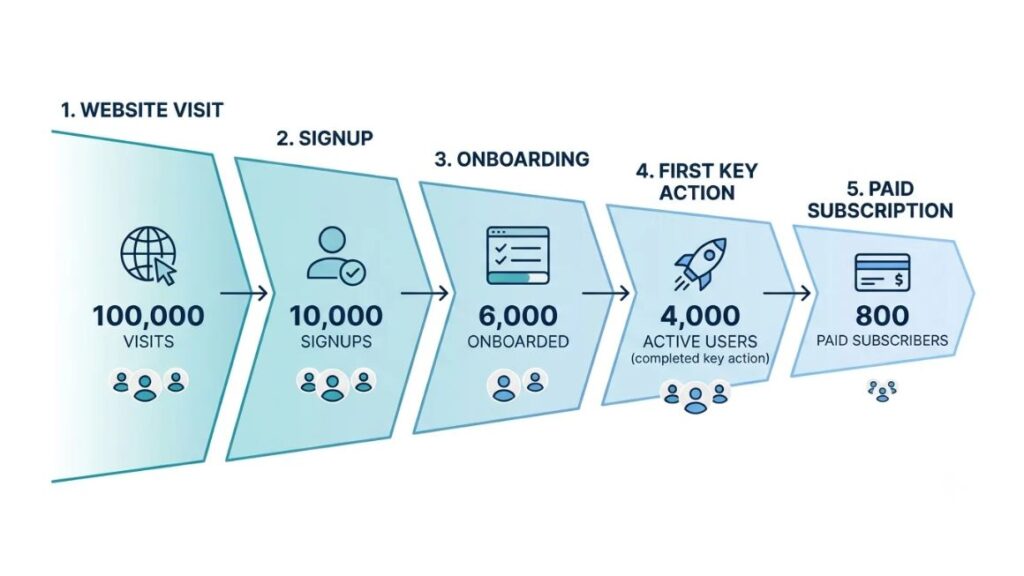
Take a simple SaaS product: website visit → signup → onboarding → first key action → paid subscription. Each step is an event your tracking records. That’s like a page view, a submitted form or a successful payment. A user counts at a step only when they complete it, usually in order. Amplitude defines total conversion as users who triggered every event. It is divided by users who triggered the first one.
Why businesses analyze user funnels
A funnel shows which step creates friction, so you stop guessing. Fixing a weak step lifts everything after it. That improves conversion and sharpens product decisions. It also tells you whether marketing attracts the right people. Cheap signups that never activate aren’t wins.
The same logic applies in retail. In an e-commerce conversion funnel, the steps might be product view, add to cart, begin checkout and p`urchase. Baymard Institute’s running tally of 49 studies puts average cart abandonment at 70.19% (last updated July 2023), so losing most carts isn’t unusual. Where your own losses cluster matters more than that average.
Why Funnel Analysis Matters for Product Growth
An overall conversion rate can look healthy while one step quietly bleeds users. Averages hide the shape of a problem. Product funnel analysis breaks the total into steps. So you can see which one is responsible.
Find the steps where users abandon the journey
Run a proper user drop-off analysis and the vague complaint “people aren’t converting” becomes a named step with a number attached. Someone can own that and fix it. It also stops a team from redesigning the whole signup flow when only the email verification step is broken.
Understand the difference between traffic and meaningful engagement
Ten thousand visitors isn’t ten thousand prospects. If only 300 of them ever reach the first key action, your real audience is closer to 300. Reporting on that group gives a truer picture than any pageview count.
Prioritize improvements using evidence rather than guesswork
Every team has a backlog full of decent ideas. A funnel helps you sort it. A small fix at the biggest leak can outweigh a big redesign somewhere that barely loses anyone.
Also Read: Best Customer Funnel Analysis Tools to Track and Optimize Conversions in 2026
Understanding the Main Stages of a Product Funnel
Most product funnels move through five stages: awareness, consideration, signup, activation and retention. Treat them as a flexible model, not a rule, whenever you plan a product funnel analysis. A mobile game might skip consideration entirely. A B2B tool might loop back through it before every renewal. Plenty of self-serve products let people activate long before they pay. What matters in conversion funnel analysis is that each stage is defined by something users actually do. It’s definitely not decided by what a slide deck says they do.
Awareness and acquisition
This is where people first find you: organic search, paid ads, referrals, social posts or a mention in a newsletter. The numbers here are the widest and the least informative on their own. Channel matters more than volume. Each source brings a different kind of visitor.
Consideration and exploration
Visitors look around. They read feature pages, compare you with alternatives and check pricing. Pricing page visits are worth tracking closely. That’s because someone who comes back to that page twice is probably weighing a decision.
Signup and onboarding
People register, then set the product up. The goal of this stage isn’t a completed form. It’s the first meaningful outcome. That’s like a connected data source or a first saved project. Plenty of teams measure signups, call it done and then wonder why growth feels thin.
Activation and conversion
Activation is the moment a user experiences the product’s core value. Where there’s a paid plan, conversion follows, although some products convert before users activate. That’s a different problem to solve. Define your activation event with care. That’s because everything downstream depends on it.
Retention and expansion
Repeat usage, renewals, referrals and upgrades show whether the value lasted. A user who pays once and never returns is a churn risk, not a success. Most funnels stop at purchase. The better ones keep going.
How to Conduct a Product Funnel Analysis Step by Step?
You can run a product funnel analysis in seven steps. Define one goal. Map the real journey. Set tracking rules. Build the report. Measure drop-off. Segment users. Then investigate and test. Skipping the first three is what makes most funnel reports misleading.
Step 1: Define the business goal
Choose one outcome. Completed purchases, successful onboarding and paid subscriptions all work, but pick a single one per funnel. A funnel that tries to serve three goals measures none of them well. Write the goal as a sentence your team agrees on, such as “a new user connects their first data source within seven days.”
Step 2: Map the user journey
Document what users really do, not the path you wish they’d take. Look at event data or a sample of recordings and sketch the common routes. This is basic user journey analysis, and it often turns up surprises, like people reaching checkout through an emailed link that skips your product page.
Step 3: Define events and tracking rules
Write down each step as an event, with the properties you’ll need later, such as plan type, device and acquisition channel. Set identity rules too. If someone browses anonymously on Monday and signs up on Tuesday, your tool has to stitch those into one user. Then choose a conversion window, which is how long a user has to finish the funnel. Amplitude’s default is one day (it stretches to 366), so a purchase on day three can vanish from a report nobody adjusted.
Finally, check that events fire correctly before you trust a single number. GA4’s DebugView exists for exactly this reason, and most other tools have a live-event view.
Step 4: Build the funnel report
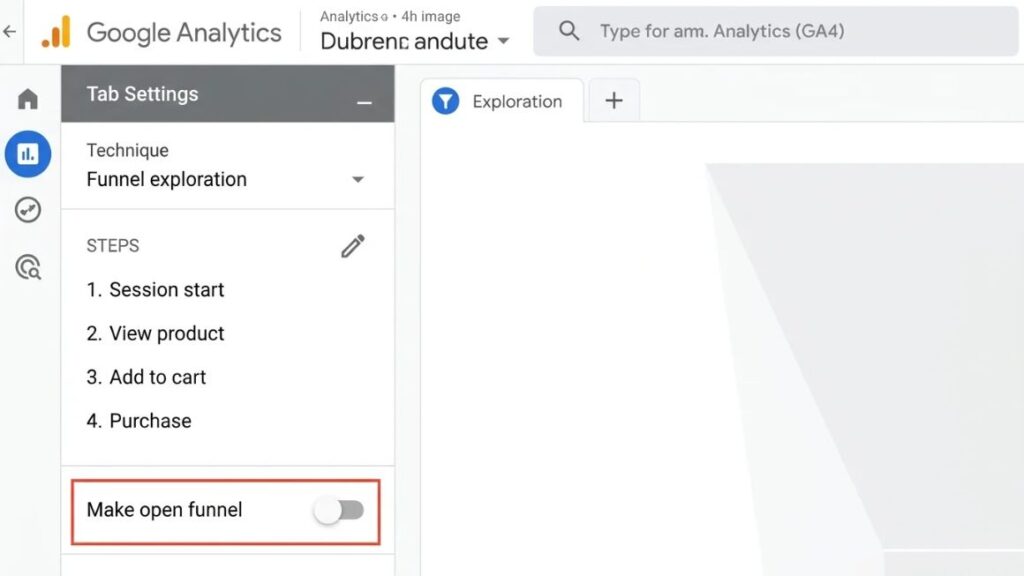
Set up the steps in your analytics platform, then choose open or closed. In GA4’s Funnel exploration, a closed funnel only counts users who enter at the first step, while an open funnel lets them enter at any step. Closed answers “of the people who started, how many finished?” Open answers “how many reached each step, however they got there?” Pick the one that matches your question, and say which you used.
Also Read: 15 Best Marketing Analytics Tools: Features, Pricing & Use Cases
Step 5: Measure conversion and drop-off
Calculate step-level conversion and drop-off, then look for the biggest loss. Check both the percentage and the number of people. A steep drop at the top of a funnel is expected. A similar drop in the middle of the product deserves attention.
Step 6: Segment users to find patterns
Averages hide the real story, so split the funnel. Compare mobile with desktop, paid with organic, new with returning users and any customer groups that matter to your business, such as company size. A step that looks mediocre overall may be broken for one segment only. That’s a much easier thing to fix.
Step 7: Investigate, test, and monitor
The funnel tells you where, not why. For the why, watch session recordings, read support tickets and feedback, and check for technical problems like slow pages or errors on one browser. Turn what you find into a hypothesis. Then test it with a controlled experiment instead of shipping the change to everyone. After launch, keep watching, because early gains sometimes fade.
A reliable funnel analysis starts with one goal, real user paths and tested tracking before any report is built. The funnel shows where users drop off, while recordings, feedback and controlled experiments explain why and confirm whether a fix works.
Key Metrics to Measure Funnel Performance
Five metrics cover most decisions in a product funnel analysis. Start with the overall funnel conversion rate, which is users who complete the last step divided by users who entered the first. Then break it down. Whatever you calculate, write down the denominator. Most arguments about funnel numbers are really arguments about what got divided by what.
Step conversion rate
Step conversion rate = users who complete a step ÷ users who completed the previous step × 100. The denominator is the step before, not the top of the funnel.
Drop-off rate
Drop-off rate = 100% − step conversion rate, or users lost at a step ÷ users who reached it. It’s the same information from the other side, and it’s often easier to rally a team around the number you lost.
Time to convert
Time to convert is the time between a user entering the funnel and completing it. Use the median, not the average. That’s because a few slow users skew the mean. It tells you whether your conversion window is too short and which step slows people down.
Activation and retention rates
Activation rate = users who reach the activation event ÷ users who signed up. Retention rate = users still active in a later period ÷ users in the starting cohort. Pick a period that fits how often the product should be used, weekly for some products and monthly for others.
Revenue per user and paid conversion
Paid conversion rate = paying customers ÷ users at the stage you choose, whether signups or activated users, so name it. Revenue per user = revenue from a cohort ÷ users in that cohort. Don’t hunt for one industry benchmark here. Pricing, audience and traffic source change the answer, so compare against your own history first.
A Practical Example: Finding a Funnel Bottleneck
The numbers below are hypothetical. They describe an imaginary SaaS business, not a real one, and show how a product funnel analysis plays out.
Calculate conversion at each stage
| Stage | Users | Step conversion | Drop-off |
| Website visitors | 10,000 | n/a | n/a |
| Signups | 1,000 | 10% | 90% |
| Onboarding completed | 600 | 60% | 40% |
| Activated users | 300 | 50% | 50% |
| Paid customers | 90 | 30% | 70% |
Overall, 0.9% of visitors become paying customers (90 ÷ 10,000), and 9% of signups do. The steepest percentage loss is the last step, where 70% of activated users don’t pay. Now look at raw numbers after signup: 400 people vanish before finishing setup, and 300 more finish setup without reaching a first key action. Across the onboarding funnel, 700 of 1,000 signups are gone before activation.
Identify what to investigate first
Start with onboarding. It loses more people after signup than any other stage, and anything fixed there feeds every step after it. The payment step deserves a look next, but the questions are different: pricing, plan fit, trial length.
Four checks come first. Compare signup quality by channel. Watch recordings for where people stall in setup. Look for technical errors, such as a form that fails on one browser. And measure time to value, the median time from signup to first key action.
Turn findings into an experiment
Suppose recordings show stalling on a long setup form. Hypothesis: users abandon setup because it asks for too much before showing any value. The change: start new users in a pre-filled sample project and move optional setup steps to later. The outcome metric is onboarding-to-activation conversion. The guardrail metric is paid conversion among activated users, so you know the change isn’t just pushing people through without value. Set the sample size and duration before you start, and don’t promise an uplift you haven’t measured.
In the hypothetical example, 700 of 1,000 signups never reach activation, which makes onboarding the first place to investigate. The biggest percentage loss isn’t always the best place to start; the number of people lost and the effect on later steps matter too.
Best Tools for Analyzing Product Funnels
No single tool wins for every team. So choose by the question your product funnel analysis needs to answer. Product analytics tools differ most in setup effort, depth of behavioral analysis and how much of the work needs engineers.
Google Analytics 4
GA4’s Funnel exploration is the natural starting point for web and app journeys. It builds funnels from events, supports open and closed funnels, and the standard version is free. For acquisition-to-conversion questions it’s often enough. For deep in-product behavior, many teams add a dedicated tool.
Amplitude and Mixpanel
Both are event-based tools built for product behavior, with funnel, segmentation and retention analysis. Both let you stretch conversion windows to 366 days. Each also has an AI assistant for plain-language questions: Amplitude’s Global Agent and Mixpanel Agent, which was previously called Spark.
PostHog and Heap by Contentsquare
PostHog is open source and bundles funnels with session replay, feature flags and experiments, plus a monthly free allowance. Heap auto-captures user interactions so you can define funnels after the fact, and it became part of Contentsquare in 2023. Features and pricing change often, so check each vendor’s current pricing page before you commit.
How to choose the right tool?
Compare six things: implementation effort, event volume, privacy requirements, integrations, reporting needs and budget.
A small team with low traffic can learn plenty from GA4 or a free plan. A product team shipping weekly will want event-level analysis and experiments. If data residency matters, ask whether the tool can be self-hosted. Then pilot two options on one real funnel before you decide.
Common Mistakes to Avoid When Analyzing Funnels
Most product funnel analysis mistakes aren’t analytical. They’re setup and interpretation errors that make a clean-looking report wrong. Each of the six below is common, and each is cheap to avoid.
- Tracking unreliable or duplicate events. Events that fire twice, or not at all, produce confident nonsense. Audit tracking before you analyze anything, and recheck it after every release.
- Treating correlation as proof of causation. Users who watch the tutorial convert more, but motivated users watch tutorials. The video may not be the cause.
- Comparing groups with different traffic quality. Paid social visitors and newsletter subscribers are different audiences. Compare like with like, or segment the funnel by channel.
- Ignoring sample size and normal variation. A move from 4.1% to 4.6% on a few hundred users can be noise. Wait for enough data, or test properly.
- Misreading multi-device or multi-session journeys. Someone who researches on mobile and buys on desktop can look like two users unless identity rules join them.
- Changing several things at once. Redesign the page, change the price and rewrite the emails together, and you’ll never know which one moved the number. Test one change at a time, or plan the measurement first.
Best Practices and Emerging Trends for 2026
The best teams doing product funnel analysis in 2026 aren’t chasing new features. They’re getting the basics right and adding new tools carefully.
Combining behavioral data with session replay
Funnels say where users drop. Recordings and feedback help explain why. Treat privacy as a design requirement, not an afterthought. India’s DPDP Rules were notified in November 2025 and are being phased in over roughly 18 months, with notice and consent at the centre. Mask sensitive fields, collect consent where required, and check the details with your legal team.
Using AI-assisted analytics carefully
Natural-language queries and anomaly alerts can speed up investigation. Amplitude’s Global Agent can answer questions like why conversion dropped, and GA4 surfaces unusual changes through automated insights. Useful, yes. But they only work on the data you’ve tracked, so a broken event gives a confident wrong answer. Treat outputs as hypotheses and confirm them in the report.
Connecting acquisition to retention
Don’t stop the funnel at signup. Compare channels on activation, retention and payment, not just cost per signup. A channel that looks expensive upfront may bring the users who stay.
Building a continuous experimentation process
Conversion rate optimization is a habit, not a project. Keep a backlog of hypotheses, rank them by expected impact and effort, and run each test with a guardrail metric. Check long-term outcomes too. A change that lifts signups this week but hurts retention next month isn’t an improvement.
Conclusion
Product funnel analysis is less glamorous than it sounds. You pick one goal, track the steps that lead to it, find the biggest leak, work out why it’s leaking, test one fix, and check whether the number moved. Then you do it again. Run steadily, that loop beats any amount of dashboard-watching.
Start small. Build one funnel for the goal your team cares about most this quarter, check that the events fire, and spend a week with the data and the recordings. You’ll learn more from that than from another round of opinions.
And if you’d like to practice this with real data and some guidance, YUP’s Analytics course is a good place to take it further.
Frequently Asked Questions
What is product funnel analysis?
Product funnel analysis measures how many users move through each defined step toward a goal, such as signup to paid subscription, and where they drop off. It shows which step loses the most people, so you know what to fix first.
How do you calculate funnel conversion rate?
Divide the users who completed the final step by the users who entered the first step, then multiply by 100. In the example above, 90 ÷ 10,000 is 0.9%. For step-level rates, divide each step’s users by the users from the step before. Always state the denominator and the time window.
Which tools are best for funnel analysis?
It depends on the use case. GA4 suits free web and app funnels. Amplitude or Mixpanel suit deeper in-product analysis. PostHog bundles replay and experiments, and Heap relies on autocapture. Start with the tool your team will actually set up properly.
What is the difference between funnel analysis and user journey analysis?
Funnel analysis measures conversion through a fixed sequence of steps you define in advance. Journey analysis looks at the paths users actually take, including detours and loops. Use funnels to measure a known path and path tools to discover unknown ones.
How often should a product funnel be reviewed?
Glance at a dashboard weekly to catch sudden changes, and run a proper review monthly or after any release that touches a funnel step. Low-traffic products may need longer windows, since weekly numbers swing too much to read.
How can small businesses analyze funnels without an expensive tool?
Use GA4’s free Funnel exploration, or the free plans of tools like Mixpanel, Amplitude or PostHog, after checking their current limits. With no tool at all, a spreadsheet of weekly counts at each step works for a first pass.
Can AI help identify funnel drop-offs?
Yes, mainly for speed. AI features can flag unusual drops, answer plain-language questions and suggest segments to check. They can’t tell you whether tracking is correct or why users left, so confirm every finding in the funnel report.