
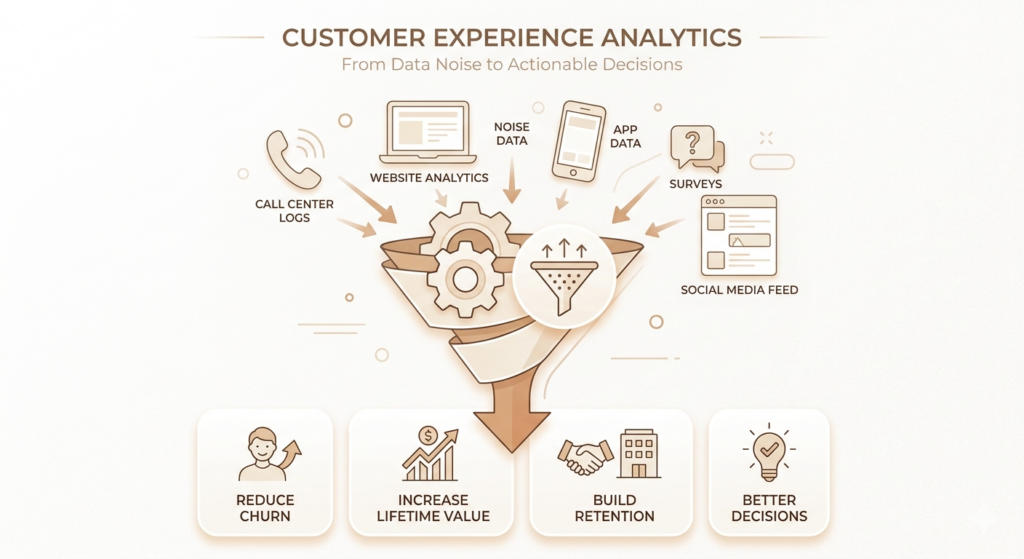
Most businesses collect customer data. Very few actually use it well. They run NPS surveys, watch bounce rates creep up, see support tickets pile in -and still struggle to answer one basic question: why are customers leaving?
That’s the gap customer experience analytics tools are built to close. These platforms connect data from every touchpoint -your website, app, call centre, social channels, surveys -and turn the noise into something a team can actually act on. Not just dashboards. Decisions.
The market has grown fast. According to Business Research Insights, the global customer experience analytics market is projected to reach $9.12 billion in 2026, growing to $18.65 billion by 2035. That kind of growth doesn’t happen unless businesses are seeing real returns. And they are: brands that use CX analytics effectively don’t just improve satisfaction scores -they reduce churn, increase lifetime value, and build the kind of retention that advertising can’t buy.
This guide covers everything: what customer experience analytics tools actually do, how to pick the right one, and which platforms are worth your attention in 2026.
Table of Contents
What Are Customer Experience Analytics Tools?
Customer experience analytics tools are software platforms that collect, process, and analyze data about how customers interact with a brand across every channel and touchpoint. The goal is to help businesses understand what customers are doing, why they’re doing it, and what can be improved to keep them coming back.
The Core Definition
A customer experience analytics tool is any platform that systematically captures and analyzes customer interaction data to generate insights that improve customer satisfaction, reduce friction, and drive retention. That definition covers a wide range of software -from session replay tools like Fullstory to full experience management platforms like Qualtrics XM.
What separates CX analytics from general data reporting is the focus on the customer’s perspective. These tools don’t just tell you that 42% of users dropped off on page three. They show you what those users were doing, what frustrated them, what they said afterward, and whether they came back.
How They Collect Customer Data Across Channels
Modern customer experience analytics tools pull data from multiple sources simultaneously:
- Website and mobile app behaviour (clicks, scrolls, session recordings)
- Customer surveys (NPS, CSAT, CES)
- Support tickets and call centre transcripts
- Social media mentions and reviews
- CRM data and purchase history
- Email engagement signals
The value of combining all of this in one place -rather than running separate tools for each -is that you get a complete view of a customer’s journey instead of fragmented snapshots.
Customer Experience Analytics vs Customer Data Analytics
The two terms get used interchangeably, but they’re not the same. Customer data analytics is a broader category: it includes any analysis of customer-related data, including financial performance, inventory planning, or market segmentation. Customer experience analytics is specifically focused on the experience -the quality of interactions, the emotional response, and the journey across touchpoints.
If customer data analytics tells you what customers bought, CX analytics tells you how they felt about the process of buying it.
Why Customer Experience Analytics Matters More Than You Think
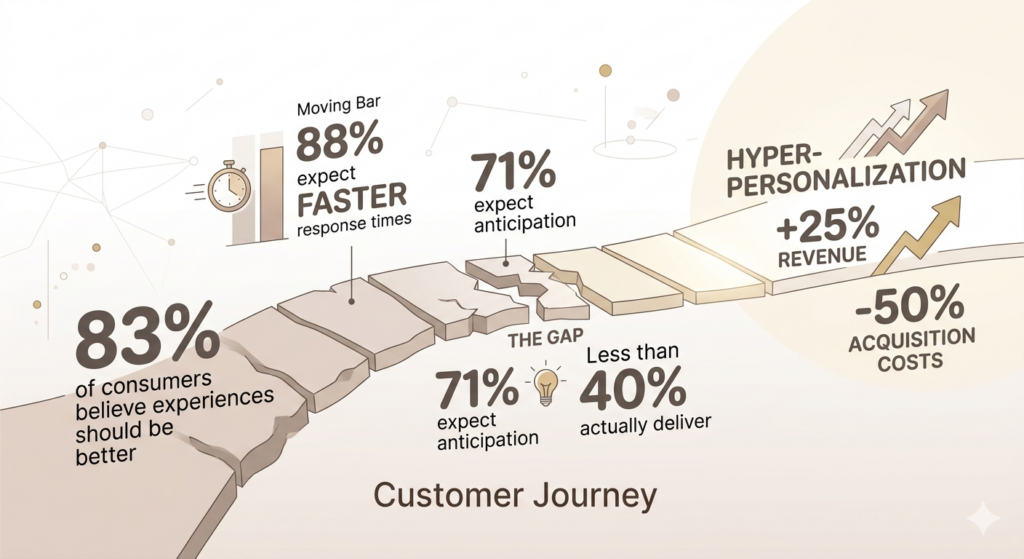
There’s a gap most brands don’t want to talk about. According to Zendesk’s CX Trends 2026 report, 83% of consumers believe experiences should be better than they currently are -even as companies spend more on CX technology than ever. That’s not an AI problem or a budget problem. It’s a measurement problem.
Businesses that don’t measure what’s actually happening in the customer journey can’t fix it. And the consequences of getting it wrong are sharp.
Customer expectations are climbing. According to Zendesk’s 2026 research, 88% of customers now expect faster response times than they did just a year ago. That bar keeps moving, and companies relying on quarterly survey results to track performance are always catching up.
Personalization has become baseline, not premium. Adobe found that 71% of consumers expect brands to anticipate their needs. Fewer than 40% of companies actually deliver this at scale. The gap between expectation and delivery is where customers leave.
Retention is far cheaper than acquisition. McKinsey estimates that hyper-personalization -the kind that requires solid CX data -can lift revenue by up to 25% and cut acquisition costs by 50%. That math is hard to argue with.
Churn signals are usually already in your data. According to a 2026 Chattermill report, 60% of companies still fail to align their CX programmes with retention KPIs. More starkly, less than half measure the impact of CX on revenue at all. The data is there. Most companies just don’t know how to read it.
Customer experience analytics tools help businesses close the gap between data collection and action. According to Zendesk’s CX Trends 2026 report, 83% of consumers believe experiences should be better than they currently are. Chattermill’s 2026 research found that 60% of companies still fail to tie their CX programmes to retention KPIs -meaning the insight exists, but goes unused.
How Customer Experience Analytics Works
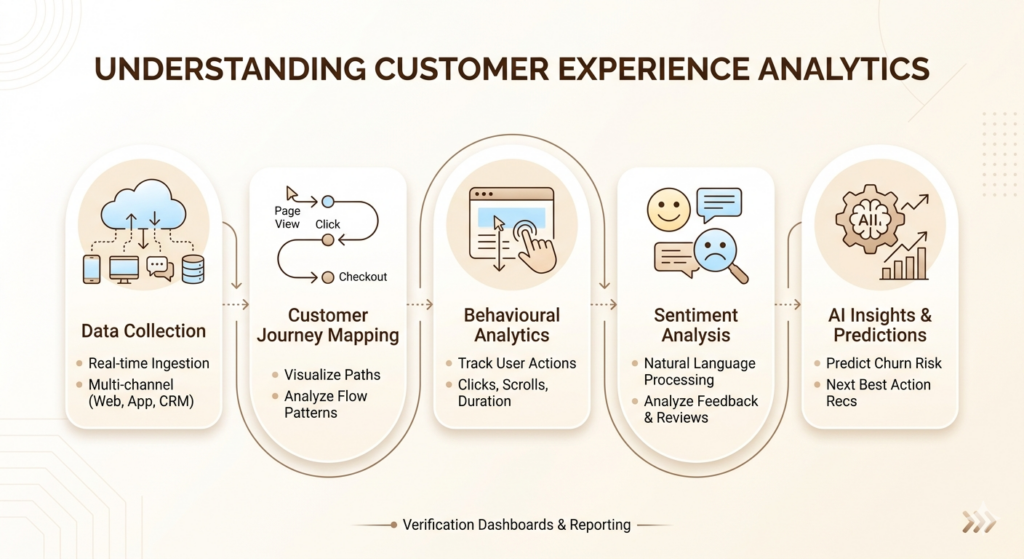
Understanding the mechanics helps you evaluate tools more clearly and implement them more effectively.
Data Collection
Every customer experience analytics platform starts with ingestion -pulling in data from every channel where customers interact with your brand. This can happen through native integrations, SDKs embedded in your website or app, API connections to your CRM, or direct CSV uploads for historical data.
The best platforms capture data in real time. If a customer abandons a checkout flow at 11:47 PM, that signal should be available to your team by 11:48 PM -not in next week’s report.
Customer Journey Mapping
Customer journey mapping inside CX analytics tools isn’t a static PowerPoint diagram. It’s a live visualization of actual customer paths -which pages they visited, in what order, where they paused, and where they left. Platforms like Contentsquare and Fullstory show journey flows at scale, so you can see patterns across thousands of sessions instead of guessing from a handful of interviews.
Behavioural Analytics
Behavioural analytics tracks what customers do rather than what they say. Clicks, scrolls, hover patterns, form interactions, session duration, feature usage -all of it gets logged. This is where tools like Amplitude and Mixpanel specialize. You can build cohorts of users who completed a specific action, track how they behave over time, and measure whether a product change actually moved the needle.
Sentiment Analysis
Sentiment analysis uses natural language processing to categorize customer language -in reviews, support tickets, survey responses, and social comments -as positive, negative, or neutral. More advanced platforms go further: they identify which topics customers feel strongly about, how sentiment shifts over time, and where negative signals cluster.
AI-Powered Insights and Predictive Analytics
This is where 2026 tools have moved well beyond what was possible three years ago. Modern CX platforms don’t just report what happened -they surface what’s likely to happen next. Predictive customer analytics flags customers at churn risk before they leave, identifies which user segments are most likely to convert, and recommends the next best action for support teams. According to Verint’s State of Customer Experience 2025 report, 86% of consumers value AI for rapid problem resolution -meaning customers themselves expect the intelligence layer to kick in fast.
Visualization Dashboards and Automated Recommendations
The final output is where a lot of tools differentiate. Raw analytics is useless if no one in your team can understand the dashboard. The best platforms in 2026 offer role-specific views -product managers see feature adoption data, marketing teams see campaign impact on satisfaction scores, support leaders see ticket trends and resolution rates -all pulling from the same underlying data.
Types of Customer Experience Analytics
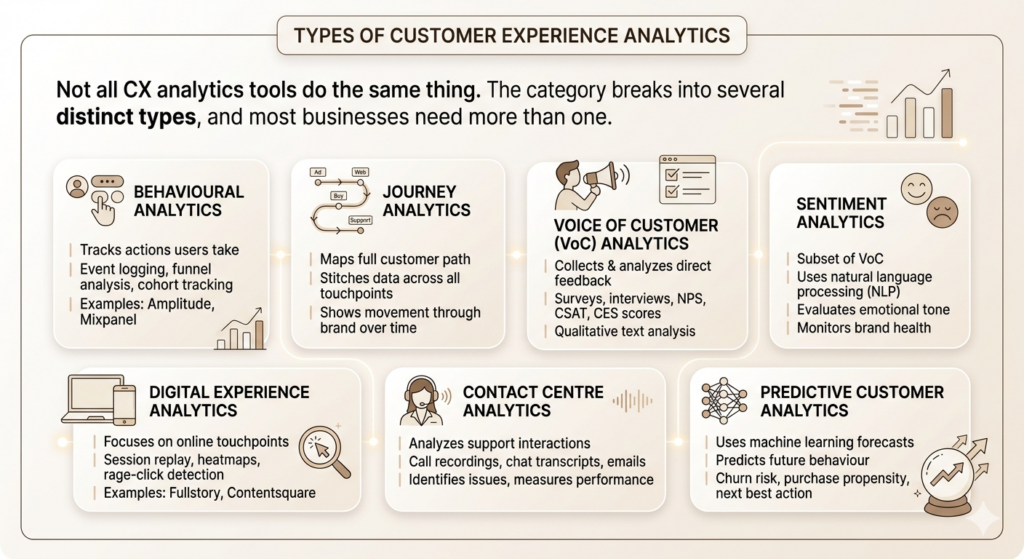
Not all CX analytics tools do the same thing. The category breaks into several distinct types, and most businesses need more than one.
Behavioural Analytics
Tracks actions users take inside your product or on your website. Think event logging, funnel analysis, and cohort tracking. Amplitude and Mixpanel are the category leaders here.
Journey Analytics
Maps the full customer path across every touchpoint -from first ad click to post-purchase support interaction. These tools stitch together data across channels to show how customers move through your brand over time.
Voice of Customer (VoC) Analytics
Voice of customer analytics collects and analyzes direct feedback from customers -surveys, interviews, in-app prompts, and review sites. NPS, CSAT, and CES scores live here, along with qualitative text analysis of open-ended responses.
Sentiment Analytics
A subset of VoC, sentiment analytics uses natural language processing to evaluate the emotional tone of customer language at scale. Useful for monitoring brand health across social channels and understanding how customers feel -not just what they think.
Digital Experience Analytics
Digital experience analytics focuses specifically on online touchpoints: websites and mobile apps. Session replay, heatmaps, and rage-click detection are the signature features. Fullstory and Contentsquare lead this category.
Contact Centre Analytics
Analyses customer interactions with support teams -call recordings, chat transcripts, email threads. The goal is to identify recurring issues, measure agent performance, and surface patterns in what customers are actually asking.
Predictive Customer Analytics
Uses machine learning to forecast future behaviour: churn risk, purchase propensity, next best action. This layer turns historical CX data into forward-looking operational intelligence.
Key Features to Look for in Customer Experience Analytics Tools
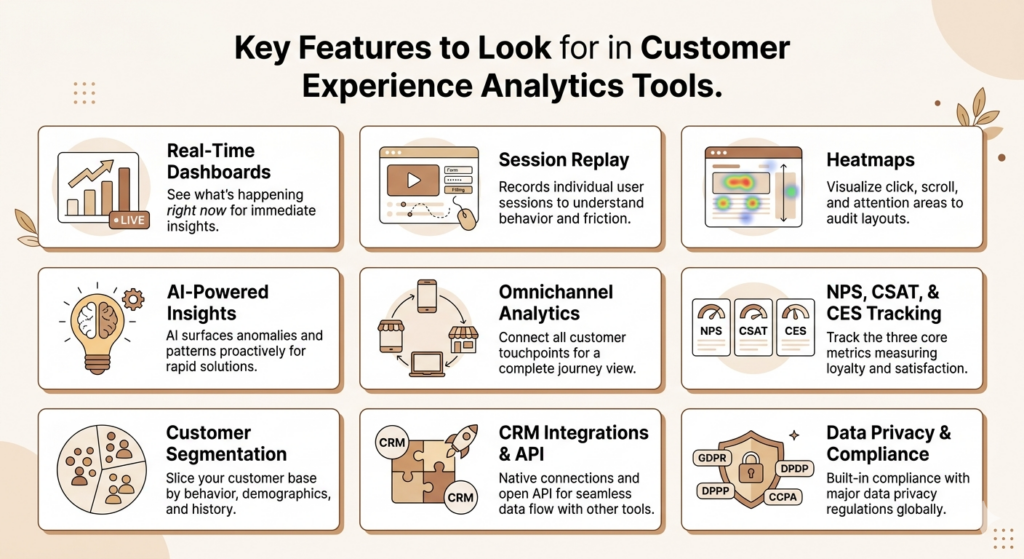
You could evaluate platforms purely on feature checklists. That approach usually ends in shelfware. The smarter move is to decide which features actually map to the problems your team is trying to solve.
That said, here’s what the best platforms offer -and what you should assess before buying.
Real-Time Dashboards
Static monthly reports don’t help a support team dealing with a spike in friction right now. Real-time dashboards let teams see what’s happening as it happens -not after the damage is done.
Session Replay
Session replay records individual user sessions and plays them back as a video -every click, scroll, and form interaction captured. This is the fastest way to understand why a specific customer dropped off somewhere in your funnel. Tools like Fullstory have built their entire reputation on the quality of this feature.
Heatmaps
Heatmaps aggregate interaction data across thousands of sessions into a visual overlay on your pages -showing where users click, how far they scroll, and which areas draw the most attention. Strong for UX teams auditing page layouts.
AI-Powered Insights
Look for platforms where AI surfaces anomalies and patterns proactively -not just tools that let you build reports manually. The difference is between a platform that shows you that churn increased and one that tells you what caused it.
Omnichannel Analytics
Your customers don’t live in just one channel. A customer might discover your brand on Instagram, visit your website three times, start a chat with support, and then convert via email. Platforms that can connect these touchpoints across channels give you a complete picture. Platforms that can’t leave you guessing.
NPS, CSAT, and CES Tracking
Net Promoter Score (NPS), Customer Satisfaction Score (CSAT), and Customer Effort Score (CES) are the three core metrics most CX programmes track. NPS measures overall loyalty, CSAT measures satisfaction after a specific interaction, and CES measures how much effort a customer had to put in to resolve something. Any serious CX analytics tool should handle all three.
Customer Segmentation
The ability to slice your customer base by behaviour, demographics, purchase history, or satisfaction score -and track how different segments behave differently -is what separates generic analytics from personalized insight.
CRM Integrations and API Support
A CX analytics platform is only as useful as its ability to connect to the rest of your stack. Check for native integrations with the CRM you’re already using -whether that’s Salesforce, HubSpot, or Zoho -and confirm the platform has a stable API if you need custom connections.
Data Privacy and Compliance
This matters more than most buyers realize at the evaluation stage. GDPR in Europe, DPDP (Digital Personal Data Protection) Act requirements in India, CCPA in California -the platform you choose needs to handle these by design, not as an afterthought. Look for data masking in session replays, clear data retention controls, and documented compliance posture.
The essential features of a customer experience analytics tool include real-time dashboards, session replay, heatmaps, NPS/CSAT/CES tracking, AI-powered anomaly detection, omnichannel data integration, and CRM connectivity. Data privacy compliance -including GDPR and India’s DPDP Act -should be evaluated as a core requirement, not a secondary consideration.
Benefits of Using Customer Experience Analytics Software
The pitch for CX analytics is usually framed around satisfaction scores. The real case is about revenue.
Better customer retention. When you can identify friction points before they cause churn, you can fix them first. That’s not speculative -it’s what the data infrastructure makes possible.
Faster issue detection. Without CX analytics, a broken checkout flow might go unnoticed for days. With real-time session replay and anomaly detection, your team can catch it in hours or minutes.
Personalized experiences at scale. Indian D2C brands like Nykaa and Mamaearth have built significant customer loyalty partly through personalized recommendations and targeted post-purchase journeys -the kind of personalization that requires clean behavioural data and the tools to act on it.
Improved marketing ROI. When you know which customer segments respond to which messages -and how satisfaction scores differ across acquisition channels -you can stop spending budget on campaigns that attract customers who immediately leave.
Better product decisions. Pendo and Amplitude both show product teams which features customers actually use versus which features the product team thinks they use. Those two lists are almost never the same.
Increased customer lifetime value. A 2024 Bain and Company analysis found that NPS Promoters deliver 600% to 1,400% more lifetime value than Detractors. CX analytics is how you identify who’s in which camp -and what to do about it.
More efficient customer support. Contact centre analytics surfaces the top 10 reasons customers are calling this week. Fix those 10 things, and ticket volume drops. That’s a measurable cost saving, not a soft benefit.
Common Use Cases by Industry and Team
Ecommerce
Cart abandonment analysis, checkout funnel optimization, session replay to identify UX friction, and post-purchase survey automation. Platforms like Contentsquare were largely built for exactly this use case.
SaaS
Feature adoption tracking, in-app NPS surveys, churn prediction, and onboarding funnel analysis. Pendo and Amplitude are the go-to platforms for SaaS products and growth teams.
Banking and Financial Services
Customer effort tracking across digital banking journeys, complaint analysis, and regulatory compliance monitoring. Glassbox is particularly strong here, partly because of its data security architecture.
Healthcare
Patient satisfaction tracking, appointment journey analysis, and support interaction sentiment. Healthcare is actually the fastest-growing segment for customer analytics adoption -growing at a 21.9% CAGR through 2031 according to Mordor Intelligence’s 2026 market analysis.
Retail
Omnichannel journey tracking (online to in-store), loyalty programme analytics, and personalization at the point of recommendation. Indian quick-commerce brands like Zepto use behavioural data to optimise their app experience and reduce drop-off at the ordering stage.
Telecom
Churn prediction, service failure detection, and contact centre analytics. Telecom companies have some of the highest customer acquisition costs of any industry, which makes retention analytics economically critical.
Marketing Teams
Campaign impact on satisfaction scores, segment-level NPS tracking, and understanding which channels attract customers who actually stay.
Product Teams
Feature usage analytics, friction analysis, A/B testing insight, and onboarding flow optimization.
Customer Support Teams
Recurring ticket categorization, agent performance measurement, sentiment analysis on support conversations, and first contact resolution tracking.
Best Customer Experience Analytics Tools in 2026
The tools below consistently appear across leading comparison reviews and analyst reports. They’re not all the same -they solve different problems at different price points, and the right choice depends heavily on your use case.
| Tool | Best For | Key Features | Starting Price |
| Fullstory | Session replay and UX investigation | Session replay, frustration signals, funnel analysis | Custom (enterprise) |
| Contentsquare | Enterprise digital experience | Heatmaps, journey analysis, AI anomaly detection | Custom (enterprise) |
| Qualtrics XM | Full experience management | VoC, NPS/CSAT/CES, journey orchestration | Custom |
| Medallia | Enterprise VoC + digital | Feedback management, digital analytics, AI insights | Custom |
| Mixpanel | Product analytics | Funnel analysis, cohort tracking, retention analysis | Free plan; paid from $28/month |
| Amplitude | Product + growth analytics | Behavioural cohorts, AI agents, experimentation | Free plan; paid from $61/month |
| Pendo | SaaS product analytics + in-app guidance | Feature adoption, in-app surveys, and onboarding | Custom (seat-based) |
| Zendesk | Customer support CX | Ticket analytics, CSAT, agent performance | From $19/agent/month |
| Glassbox | Banking and regulated industries | Session replay, compliance, and struggle detection | Custom |
| Adobe Analytics | Enterprise marketing analytics | Customer journey analytics, AI insights, omnichannel | Custom |
Fullstory
Fullstory is a digital experience analytics platform built around one core capability: showing you exactly what happened during any user session. Deploy one script, and it starts capturing DOM-level interaction data immediately -no custom tagging required, no weeks of setup.
Best features: Session replay with retroactive data capture, frustration signal detection (rage clicks, dead clicks, error clicks), funnel analysis, and Fullcapture -their server-side data capture model launched in 2026.
Pros: Fast setup. Works out of the box when your site changes -no remapping required. Strong qualitative investigation capabilities.
Cons: Quantitative analysis (funnels, retention cohorts) is thinner than analytics-first platforms like Amplitude. Best used alongside a product analytics tool rather than instead of one.
Best for: UX teams, ecommerce managers, and support teams who need to understand why specific users had specific experiences.
Pricing: Enterprise pricing only, available on request.
Contentsquare
Contentsquare is now one of the largest digital experience analytics platforms globally, covering more than 3,000 enterprise and mid-market brands across 1.3 million websites and apps. It absorbed Heap in 2023, which added autocapture product analytics to its existing heatmap and journey analysis strengths.
Best features: Zone-based heatmaps, AI-powered anomaly detection, journey analysis with sunburst visualizations, session replay, and Heap’s autocapture event model.
Pros: Breadth of capability across both UX analytics and product analytics. Strong enterprise support.
Cons: The combination of acquired tools means some modules feel disconnected. Setup can take weeks and may require custom tagging. Not built for teams that need to move fast on a tight budget.
Best for: Large ecommerce and enterprise digital teams with dedicated analytics resources.
Pricing: Custom enterprise pricing.
Qualtrics XM
Qualtrics XM is arguably the most comprehensive experience management platform available. It goes well beyond digital analytics -it handles employee experience, brand tracking, and product research alongside customer experience measurement.
Best features: Omnichannel VoC collection, NPS tracking with closed-loop follow-up workflows, customer journey orchestration, predictive intelligence, and digital experience analytics.
Pros: If you want one platform to handle your entire CX measurement programme -not just digital behaviour -Qualtrics covers more ground than almost anything else.
Cons: The breadth comes with complexity. Implementation takes time, and the platform rewards teams with dedicated CX programme managers. Overkill for small teams.
Best for: Enterprise organizations running formal CX programmes with cross-functional ownership.
Pricing: Custom. Generally positioned at the higher end of the market.
Medallia
Medallia is an enterprise customer experience management platform with a strong heritage in feedback collection and a growing digital analytics layer. It connects solicited feedback (surveys, NPS) with unsolicited signals (social listening, support transcripts) and session-level digital behaviour.
Best features: Text analytics on unstructured feedback, real-time role-based dashboards, digital session data integration, and AI-driven insight prioritization.
Pros: Excellent at connecting what customers say with what they do. Strong for CX-led organizations where satisfaction measurement and operational response are both in-house.
Cons: Heavy enterprise focus means smaller teams often find the platform more than they need.
Best for: Large enterprises in retail, financial services, and telecom that already run mature VoC programmes.
Pricing: Custom enterprise pricing.
Mixpanel
Mixpanel is a focused product analytics tool built around event-based tracking. It’s strong for growth teams who need to understand how specific user segments engage with specific product features -funnel analysis, retention curves, cohort comparisons.
Best features: Funnel analysis, retention analysis, cohort-based segmentation, customisable dashboards.
Pros: Clean, intuitive interface. Fast time to first insight. Free plan available for smaller teams.
Cons: Pricing scales quickly with event volume. No native session replay -you’ll need to pair it with a separate tool. Heap (now Contentsquare) or Amplitude cover more ground if you need both analytics and replay.
Best for: Growth teams and product managers at tech companies who want focused product analytics without enterprise complexity.
Pricing: Free plan with event cap; paid plans scale by event volume.
Amplitude
Amplitude was ranked number one across multiple categories in G2’s Winter 2026 Report and earned the highest “Current Offering” score in The Forrester Wave: Digital Analytics Solutions, Q3 2025. That’s not marketing copy -it reflects real platform depth.
Best features: Behavioural cohorts that persist across analytics, experimentation, and in-app guides; AI Agents grounded in first-party product data; session replay natively integrated with analytics; warehouse-native data ingestion.
Pros: The most complete product analytics platform for growth and data teams who’ve outgrown point solutions. Scales to billions of monthly events. Native experimentation means you can test a hypothesis and measure the result in the same platform.
Cons: Event volume pricing means teams with extremely high event counts and lean use cases should model costs carefully. Implementation works best with a planned event taxonomy -teams that skip the upfront planning feel it later.
Best for: Product, growth, and data teams who need analytics, experimentation, and session replay in one platform.
Pricing: Free plan available; paid plans from approximately $61/month, scaling by event volume.
Pendo
Pendo combines product analytics with in-app guidance -making it unusual in the category. You can track feature adoption data and then immediately deploy in-app tooltips or walkthroughs to improve it, without switching platforms.
Best features: Feature adoption tracking, in-app NPS surveys, user onboarding flows, and product roadmap management.
Pros: The analytics + guidance combination is genuinely differentiated. Strong for SaaS companies where the in-app experience is the product.
Cons: Seat-based pricing can get expensive as teams grow. The analytics depth is narrower than Amplitude for teams focused purely on behavioural analysis.
Best for: SaaS product teams who want to combine usage analytics with guided in-app experiences.
Pricing: Custom, seat-based.
Zendesk
Zendesk is primarily a customer support platform -but its analytics layer has matured significantly, making it a strong tool for support-led CX measurement.
Best features: CSAT tracking, ticket analytics and categorization, agent performance dashboards, Zendesk AI for sentiment analysis and automated routing.
Pros: If your CX programme is anchored in customer support (as it is for many D2C brands), Zendesk’s native analytics cover a lot of ground without requiring a separate tool. Strong integration with the rest of the Zendesk suite.
Cons: Limited as a standalone CX analytics platform. Doesn’t handle session replay, journey mapping, or deep behavioural analytics.
Best for: Customer support teams who need analytics built into their helpdesk, not bolted on.
Pricing: From $19 per agent per month.
Glassbox
Glassbox is a digital experience analytics platform with a particular focus on regulated industries -banking, insurance, financial services. Its data architecture is built around compliance and security from the ground up.
Best features: Session replay with automatic data masking, struggle detection, compliance-ready data storage, and mobile app analytics.
Pros: The go-to choice for teams in regulated industries where data security is non-negotiable. Strong struggle signal detection identifies customer friction without manual tagging.
Cons: Less relevant for teams outside regulated industries. Limited product analytics depth compared to Amplitude or Mixpanel.
Best for: Banks, insurers, and financial services companies that need session-level digital analytics within a strict compliance framework.
Pricing: Custom enterprise pricing.
Adobe Analytics
Adobe Analytics is the enterprise marketing analytics platform, built to handle customer journey data across both digital and offline channels at massive scale. It sits within the broader Adobe Experience Cloud, so it integrates natively with Adobe Target, Adobe Campaign, and Adobe Real-Time CDP.
Best features: Cross-channel customer journey analytics, AI-driven segmentation and forecasting via Adobe Sensei, flexible data framework for structured and unstructured data, and real-time reporting.
Pros: Unmatched depth for enterprise marketing teams who are already invested in the Adobe stack. Strong AI capabilities for automated insight generation across billions of data points.
Cons: Complex to implement and expensive. Best suited for large organizations with dedicated analytics teams. Not the right starting point for mid-market teams.
Best for: Enterprise marketing teams running complex omnichannel programmes inside the Adobe Experience Cloud ecosystem.
Pricing: Custom enterprise pricing.
The best customer experience analytics tools in 2026 serve distinct use cases: Fullstory and Contentsquare lead for digital experience and session-level UX analysis; Amplitude and Mixpanel lead for product and growth analytics; Qualtrics XM and Medallia lead for enterprise VoC and full CX programme management. Choosing the right tool depends on whether your primary questions are qualitative (why did this session go wrong?) or quantitative (which cohorts retain at the highest rate?).
How to Choose the Right Customer Experience Analytics Tool
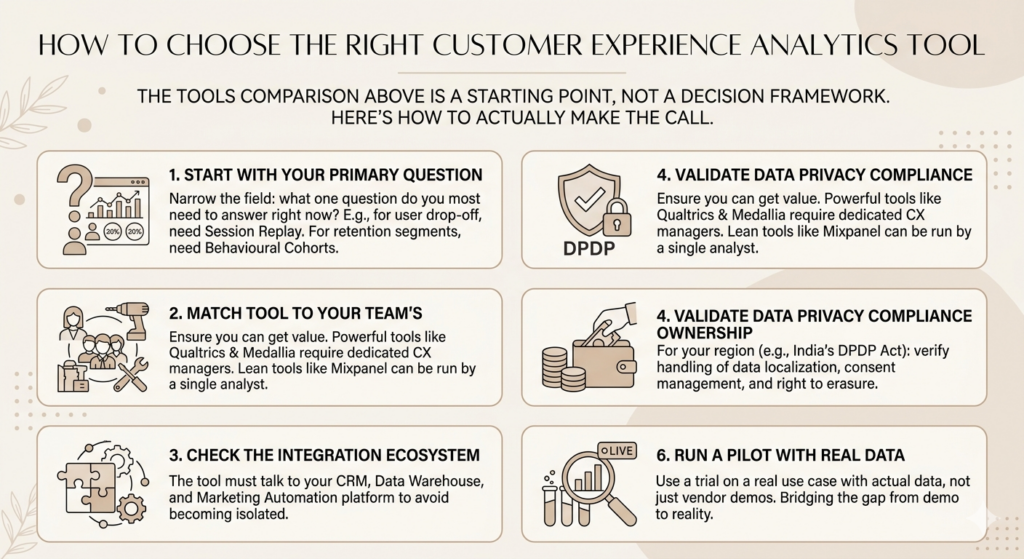
The tools comparison above is a starting point, not a decision framework. Here’s how to actually make the call.
Start with your primary question. The clearest way to narrow the field is to ask: what’s the one question I most need to answer about my customers right now? If it’s “why are users dropping off in the checkout flow?” -you need session replay. If it’s “which user segments have the highest retention?” -you need behavioural cohorts. Different questions point to different tool categories.
Match the tool to your team’s resources. Qualtrics and Medallia are powerful, but they require dedicated CX programme managers to get value from them. Mixpanel is far lighter -a single product analyst can get up and running in a day. Enterprise tools running on lean teams often become expensive dashboards that nobody checks.
Check the integration ecosystem. Your CX analytics tool needs to talk to your CRM, your data warehouse, and ideally your marketing automation platform. Broken integrations are the fastest way for a platform to become an island.
Validate data privacy compliance for your region. Indian companies operating under the DPDP Act should verify how any platform handles data localization, consent management, and the right to erasure. This isn’t optional.
Ask about the total cost of ownership, not just license fees. Implementation costs, professional services, and the internal time required to build reports often exceed the licence fee in year one.
Run a pilot with real data. Most platforms offer a trial. Use it on a real use case with your actual data -not a vendor-provided demo environment. The gap between demo and reality is often significant.
Challenges Businesses Face with Customer Experience Analytics
Buying the tool is the easy part. Here’s what actually makes implementation hard.
Data silos. The average enterprise uses 91 marketing technology tools (Scott Brinker’s 2024 MarTech Landscape). Getting CX data to flow cleanly between all of them requires real integration work -and most teams underestimate how long it takes.
Poor data quality. Garbage in, garbage out. If your event taxonomy is inconsistent, your session data has gaps, or your survey responses are collected with biased question design, the insights your tool surfaces will be wrong. No platform can compensate for bad input data.
Integration complexity. According to Global Growth Insights’ 2026 CEM market research, around 64% of companies struggle to connect CRM, analytics, and communication platforms. That’s not a technology problem -it’s an architecture problem that requires planning before you select tools.
Privacy regulations. As more markets introduce data protection frameworks -GDPR in Europe, DPDP in India, CCPA in California -the compliance requirements for how you collect, store, and process customer data become more complex. CX tools that weren’t built with privacy controls create liability.
User adoption. A platform with 50 dashboard types and custom report builders can paralyze a team that needs three metrics. Keep the initial rollout focused on answering one or two core questions well. Expand from there.
Measuring ROI on CX investments. This is the hardest one. According to Chattermill’s 2026 State of CX Intelligence Report, 62% of organizations admit they aren’t fully using the CX insights they collect. The problem isn’t data -it’s connecting insights to revenue outcomes that leadership will fund.
Best Practices for Successful Customer Experience Analytics
Define Clear CX Goals Before You Buy a Platform
Most failed CX analytics implementations have one thing in common: the team bought a platform before defining what success looked like. Start with the business outcome -reduce churn, increase NPS, improve checkout conversion -and work backward to the data and tools you need.
Track the Right KPIs for Your Stage
Early-stage: focus on NPS, CSAT, and session-level friction analysis. Mid-stage: add cohort retention, churn prediction, and journey-level drop-off analysis. Mature: layer in predictive analytics, lifetime value modelling, and segment-level personalization.
Combine Qualitative and Quantitative Data
Quantitative data tells you what is happening. Qualitative data -session replays, survey verbatims, support call transcripts -tells you why. The insight that actually changes something usually comes from connecting the two. A retention cohort showing high churn among a specific user segment only becomes actionable when you pair it with session replays showing what those users experienced.
Use AI for Predictive Insights -But Stay Skeptical
The 2026 CX trend reports are full of AI capability claims. The most useful question to ask a vendor: Can the platform show the drivers behind an insight, or does it only output a score? A churn risk score with no explanation isn’t actionable. A churn risk score that says “these 47 customers all experienced the same friction point at step 3 of onboarding” is.
Act on Customer Feedback Quickly
The closed-loop principle: if a customer gives you feedback, someone on your team needs to acknowledge it and act on it within a defined window. Medallia and Qualtrics have built automated closed-loop workflows for exactly this. The brands that use them see higher NPS over time than those that collect feedback and do nothing.
Share Insights Across Departments
CX data sitting only with the CX team is wasted. The support ticket trends that the support team sees should inform product roadmap decisions. The onboarding friction that the product team sees should inform what marketing promises in their ads. According to Zendesk’s CX Trends 2026 report, 81% of CX leaders say giving every employee access to customer insight will transform decision-making. Build the infrastructure that makes that possible.
Successful customer experience analytics programmes share three characteristics: they connect CX data to specific business outcomes (revenue, churn, retention); they combine behavioural data with qualitative feedback rather than relying on either alone; and they make insights accessible across departments, not just the CX team. The tools matter less than these structural decisions.
Customer Experience Analytics Trends for 2026
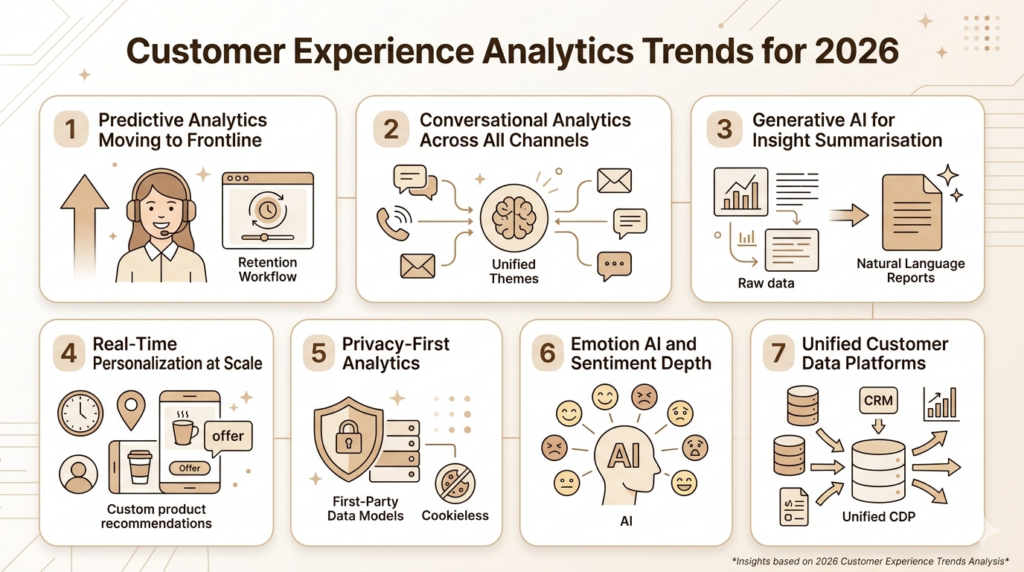
Predictive Analytics Is Moving to the Frontline
Predictive customer analytics used to live in quarterly analyst decks. In 2026, it’s moving into day-to-day operations. Churn risk signals are now informing frontline retention workflows in real time. Demand forecasting is changing how support teams are staffed. According to CX Today’s 2026 analysis, the shift is from analytics as a reporting function to analytics as an operational layer.
Conversational Analytics Across All Channels
Historically, conversation analytics was voice-first -call recordings and transcripts. In 2026, the intelligence layer is expanding into chat transcripts, email threads, and messaging platforms, then unifying themes across all of them. If your analytics only understand calls, you’re missing a significant share of the signal.
Generative AI for Insight Summarisation
GenAI is showing up in CX platforms primarily as a summarisation layer -converting raw data and session insights into natural language reports that non-analysts can act on. Amplitude’s AI Agents, for example, can answer analytical questions grounded in first-party product data without requiring a data analyst to build the query.
Real-Time Personalization at Scale
The combination of unified customer data and faster AI inference is making real-time personalization more accessible. Indian brands like Swiggy have been doing versions of this for years -surfacing restaurant recommendations based on real-time location, time of day, and order history. In 2026, that capability is spreading beyond tech-native brands to mid-market players in retail and financial services.
Privacy-First Analytics
As data protection regulations expand globally, privacy-first analytics architecture is becoming a competitive differentiator rather than a compliance checkbox. Tools that offer server-side tracking, cookieless measurement, and first-party data models are gaining share at the expense of legacy platforms built on third-party cookies.
Emotion AI and Sentiment Depth
Sentiment analysis has historically classified feedback as positive, negative, or neutral. Emotion AI goes further -identifying specific emotional states (frustration, confusion, delight) from text, voice, and even video interaction data. Crescendo.ai claims 99.8% accuracy on CSAT and sentiment detection from conversation data. Expect this capability to become table stakes rather than a premium add-on.
Unified Customer Data Platforms
The clearest infrastructure trend is consolidation. Businesses are moving away from stacked point solutions toward unified customer data platforms (CDPs) that feed a single CX analytics layer. The old model was 15 tools talking to each other through APIs. The new model is one data infrastructure with analytics, personalization, and activation built on top.
Conclusion
Customer experience is no longer a soft metric. It’s a revenue driver with measurable impact on retention, lifetime value, and acquisition cost. The businesses getting this right in 2026 aren’t the ones with the most customer data -they’re the ones using customer experience analytics tools to turn that data into decisions.
The right platform depends on where you’re starting. A SaaS team trying to understand which features drive retention needs Amplitude or Pendo -not an enterprise VoC platform with a six-month implementation timeline. A banking brand that needs session-level compliance-ready analytics needs Glassbox -not a lightweight heatmap tool built for ecommerce.
Start by defining the one business question you need to answer about your customers. Pick the tool category that answers it. Implement it properly, connect it to your other data sources, and make the insights available to every team that needs them. That’s the infrastructure that separates companies with good CX scores from companies with strong retention.
If you want to go deeper on analytics as a career skill -not just as a tool selection exercise -the Crystal Clear Newsletter covers marketing analytics, attribution, and data-driven decision-making every week, written for practitioners who need to use this stuff, not just read about it.
Frequently Asked Questions (FAQs)
What are customer experience analytics tools?
Customer experience analytics tools are software platforms that collect and analyze data from every touchpoint where a customer interacts with a brand -websites, apps, support channels, surveys, and social media. The goal is to generate actionable insights that improve satisfaction, reduce churn, and drive revenue growth.
How do customer experience analytics tools work?
They work by ingesting data from multiple sources (app behaviour, survey responses, support tickets, CRM data), then processing and visualizing that data through dashboards, journey maps, session replays, and AI-generated insight summaries. The best platforms connect quantitative behavioural data with qualitative feedback to show not just what customers did, but why.
What’s the difference between customer analytics and customer experience analytics?
Customer analytics is a broad category that covers any analysis of customer data -including financial, operational, and market analysis. Customer experience analytics is specifically focused on the quality of customer interactions: how customers feel, where they encounter friction, and how their experience influences retention and loyalty.
Which customer experience analytics tool is best for small businesses?
For small businesses, Mixpanel and Zendesk offer the best entry points. Mixpanel has a free plan and lets growth teams track product behaviour without enterprise complexity. Zendesk’s analytics are built into a helpdesk platform that many small teams already use. Both give you meaningful CX data without six-month implementation timelines.
What metrics should businesses track with CX analytics tools?
Start with NPS (overall loyalty), CSAT (post-interaction satisfaction), and CES (customer effort score). Add session-level metrics like funnel completion rates and drop-off points. As your programme matures, layer in cohort retention rates, churn prediction scores, and customer lifetime value by segment.
Can AI improve customer experience analytics?
Yes, significantly -but not all AI implementations are equally useful. The most valuable AI in CX analytics surfaces the drivers behind insights, not just scores. A churn risk model that shows you which specific friction points correlate with churn is actionable. A churn risk score with no explanation isn’t. According to Verint’s State of Customer Experience 2025 report, 86% of consumers already value AI for faster problem resolution -which means the expectation of AI-assisted support is baked in.
Are customer experience analytics tools suitable for SaaS companies?
SaaS companies are among the heaviest users of CX analytics tools -particularly platforms like Amplitude, Pendo, and Mixpanel that specialize in product behaviour tracking, feature adoption, and in-app experience measurement. For SaaS, the CX is the product, which makes analytics infrastructure foundational rather than optional.
How much do customer experience analytics platforms cost?
Pricing varies enormously. Mixpanel has a free plan; paid plans scale by event volume. Zendesk starts from $19 per agent per month. Enterprise platforms like Qualtrics, Medallia, Contentsquare, and Adobe Analytics all use custom pricing -typically starting well above $50,000 per year for mid-market deployments. Always factor in implementation costs, which can equal or exceed the licence fee in year one.
What integrations should a CX analytics tool support?
At minimum: your CRM (Salesforce, HubSpot, or equivalent), your data warehouse (BigQuery, Snowflake, Redshift), your customer support platform, and your marketing automation tool. If you’re running mobile apps, confirm the platform has a stable SDK for iOS and Android. API support matters for any custom integrations your tech team needs to build.
How do customer experience analytics tools improve customer retention?
By making churn signals visible before customers leave. A tool that flags customers who experienced repeated friction, gave low effort scores, and haven’t logged in for seven days gives your retention team something to act on -a segment to reach, a message to send, a problem to fix. Without analytics infrastructure, that churn just looks like a number on a monthly report, by which point it’s too late.
Is the customer experience analytics market growing in India?
Yes. According to Global Growth Insights’ 2026 CEM market analysis, Asia-Pacific accounts for approximately 25% of the global CX management market and is expanding rapidly due to digital transformation investment across the region. Indian enterprises in BFSI, ecommerce, and telecom are among the fastest adopters -driven partly by rising consumer expectations for digital service quality and partly by the competitive pressure from digitally native brands like Zepto, boAt, and Razorpay that have set high CX benchmarks.