
Here’s a scenario that probably sounds familiar. Traffic’s decent. Ad spend is manageable. But somewhere between the first click and the actual purchase, or the signup and the paid conversion, something is bleeding. You can feel it in the numbers. You just can’t point to it.
That’s what customer funnel analysis tools are actually for. Not dashboards for dashboards’ sake. Not another platform to check every morning. They exist to answer one specific question: where exactly are users giving up, and why?
The catch is that “funnel analysis tool” now covers everything from a free GA4 Exploration report to a six-figure enterprise platform with AI anomaly detection. Most of them will happily take your money. Not all of them are right for what you’re actually trying to fix.
This guide cuts through that. You’ll get a clear breakdown of what these tools do, how the better ones have evolved in 2026, which platforms actually work for which business types, and how to pick one without spending three months in an evaluation spiral.
[IMAGE: hero image showing a funnel visualization dashboard with multiple stages and drop-off percentages]
Table of Contents
What Are Customer Funnel Analysis Tools?
Let’s get the definition out of the way, because it’s genuinely useful here.
Customer funnel analysis tools track how users move through a defined sequence of steps toward a conversion goal. That could be an e-commerce purchase, a SaaS trial activation, a B2B lead form, or a mobile app subscription. The tool logs each step, shows you how many users complete it, and surfaces where the drop-offs happen.
That sounds simple. The difference between a funnel tool and regular web analytics is significant, though. Google Analytics tells you that 8,000 people visited your pricing page last month and 3% converted. A funnel analysis tool tells you that 68% of those 8,000 made it to the pricing page from your trial signup flow, 41% of them viewed the comparison table, and virtually all of them left within 30 seconds of seeing the annual plan pricing. Those are different problems with different fixes.
How the Mechanics Actually Work
The whole thing runs on event tracking. Every user action, clicking a button, filling a form, completing a checkout step, or watching a video, triggers an event that gets logged. You then define a funnel as a sequence of these events, and the tool measures progression and drop-off across them.
Most platforms layer in:
- Cohort analysis so you can track groups of users over time based on when they first signed up or converted
- Session analysis that captures the full browsing context within a single visit
- Attribution modeling that credits the right channels for funnel conversions
- AI-based anomaly detection on the better platforms, which flags sudden conversion drops before you’ve even noticed them manually
Why This Has Gotten More Complicated, Not Less
Customer acquisition costs have risen sharply over the past few years. According to a 2024 report by ProfitWell, average CAC across SaaS and e-commerce categories went up 60% over five years. When it costs more to get someone to your product, losing them in the funnel hurts more.
And journeys aren’t linear anymore. A user finds your brand through a YouTube ad, researches on mobile while commuting, then converts on a laptop three days later. Tools that can’t stitch that together are only seeing part of the picture, and often the least useful part.
Customer funnel analysis tools track how users move through defined conversion stages and identify where drop-offs occur. As customer acquisition costs rise and journeys fragment across devices and channels, funnel analytics has moved from a reporting function to a core growth function. Teams that can’t identify drop-off points by segment are optimizing blind.
Types of Funnels Businesses Track
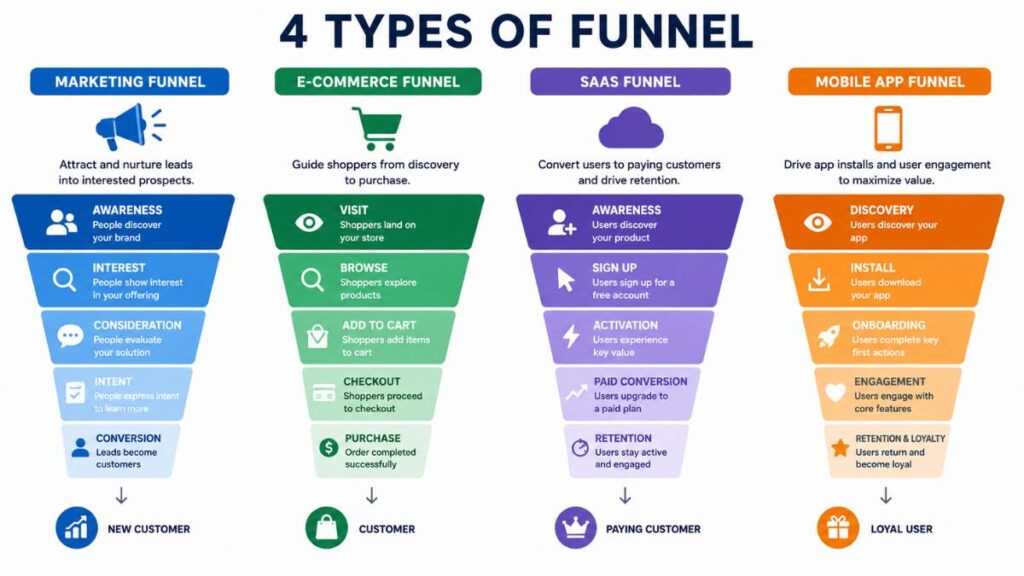
Not all funnels look alike, and this matters a lot when you’re choosing a tool. The right platform for a SaaS onboarding funnel isn’t necessarily the right one for a paid acquisition funnel.
Marketing Funnel Analysis
This tracks the path from ad click or organic visit through to a lead or purchase. The key stages typically run through landing page, form fill, and CRM entry or checkout. Attribution is a big deal here because you need to know which channels and campaigns are actually driving conversions, not just traffic.
E-commerce Funnel Analysis
For e-commerce teams, the funnel runs from product discovery through add to cart, checkout, and purchase. Cart abandonment sits between add to cart and checkout, and it’s where most revenue leaks happen. Nykaa, for instance, has built entire CRO programs specifically around mobile checkout drop-off, where abandonment rates tend to run 15 to 20 percentage points higher than desktop.
SaaS and Product Funnel Analysis
SaaS funnels care about one thing above everything else: activation. That’s when a trial user has completed the core action that predicts long-term retention. The trial-to-paid conversion rate matters, but you can’t improve it without knowing what happens in the product before that decision point. That’s exactly why product analytics tools like Mixpanel and Amplitude exist.
Mobile App Funnels
Install to first action, first action to habitual use. Mobile funnels are brutal at the top. According to Appsflyer’s 2023 App Marketing Report, more than 70% of users who install an app never return after the first session. That’s not a traffic problem. That’s an onboarding problem, and funnel analysis is the only way to find exactly where it breaks.
Key Features Worth Paying Attention To
There are features every platform claims to have. These are the ones where the real differences live.
Funnel Visualization That’s Actually Readable
You need to see drop-off at every stage, with real numbers and percentages, the ability to compare across time periods, and enough segment filtering to see whether mobile vs desktop or paid vs organic behaves differently. If your team can’t glance at the dashboard and immediately understand what’s wrong, the tool won’t get used consistently. That sounds obvious. It almost never gets weighted properly in tool evaluations.
Custom Funnel Builders Without Engineering Dependency
This separates the good tools from the frustrating ones. Mixpanel and Amplitude let a product manager or marketer build a new funnel report in a few minutes with drag-and-drop event selection. Older tools often require a SQL query or an engineering ticket for every new analysis. If you’re on a fast-moving team, that dependency kills the whole point of having funnel data.
Cohort and Retention Analysis
Cohort analysis groups users by when they first performed an action and tracks how they behave over time. This is where the honest retention story lives. A cohort tool helps you answer real questions, like whether users who completed onboarding in under three minutes actually retained better at the 30-day mark. Any funnel tool pitched at SaaS teams that doesn’t include this is incomplete. Full stop.
Session Replay and Heatmaps
Here’s the honest truth about quantitative funnel data: it tells you where users leave. It doesn’t tell you why. Session replay fills that gap. Watching a few dozen recordings of users who dropped off at step three of your checkout will surface patterns that no event data ever will. Heatmaps show you where users are clicking, scrolling, and ignoring. That qualitative layer is what turns a data point into an actual UX fix.
AI-Powered Anomaly Detection
In 2026, the platforms worth using don’t just sit there waiting for you to pull reports. Amplitude and Mixpanel both flag conversion drops automatically when step performance moves outside expected variance. That means you find out about a checkout conversion problem on day one instead of day seven. That week of delay used to cost brands real revenue and nobody could quantify it. Now the tool catches it.
First-Party and Cookieless Tracking
Third-party cookies are gone in any practical sense. iOS privacy changes have eroded mobile tracking significantly. If the tool you’re evaluating still relies heavily on cookie-based tracking, you’re building on shaky ground. The platforms that’ve moved to first-party event data and consent-based tracking will stay accurate longer than those that haven’t.
The most useful funnel analytics features in 2026 include drag-and-drop funnel builders, session replay for qualitative diagnosis, AI-powered anomaly detection, cohort analysis for retention tracking, and cross-channel attribution modeling. Teams should prioritize tools that support cookieless, first-party tracking as third-party cookie deprecation becomes permanent.
How AI Has Changed Funnel Analysis
Not in the hype way. In a genuinely practical way.
Drop-Off Detection Is No Longer Manual
The old workflow was this: analyst pulls funnel data on Monday, notices checkout conversion is down 12%, investigates on Tuesday, finds the cause on Wednesday, flags it to the team on Thursday. That’s a four-day delay on a problem that started affecting revenue on Sunday. Amplitude and Mixpanel both now surface these drops automatically, identify which user segments are most affected, and in some cases point to likely causes. That’s a real change.
Predictive Analytics at the User Level
The better platforms now give you churn probability scores and predicted conversion likelihood at the individual user level. A SaaS company using Amplitude can see which trial users are statistically unlikely to convert, based on behavioral patterns, and trigger a campaign before they churn. That’s a fundamentally different posture from analyzing who already left and wondering why.
Behavioral Segmentation That Doesn’t Require a Hypothesis
Manual segmentation requires you to hypothesize first. “Let’s see if mobile users from paid search convert differently.” You can run that comparison, but you’re limited to the segments you thought to check. Machine learning-driven segmentation, which both Amplitude and Mixpanel offer in their AI tiers, clusters users by behavioral patterns automatically and surfaces the ones that convert differently without needing a human to guess in advance. That’s a capability shift, not just a speed improvement.
The Awkward Reality of AI Search and Funnels
Google AI Overviews and zero-click search have created a gap at the top of the marketing funnel that most teams aren’t accounting for. According to Similarweb’s 2024 Digital Report, 65% of Google searches now end without a click to any website. That means users are arriving with more pre-formed intent, sometimes skipping awareness stages entirely, and sometimes converting without ever touching the top of your tracked funnel. Funnel tools don’t have a clean answer to this yet. Worth being honest about that.
Read also: How to Track Website Conversions Using Google Analytics
Best Customer Funnel Analysis Tools
Google Analytics 4 (GA4)
Start here if you haven’t yet.
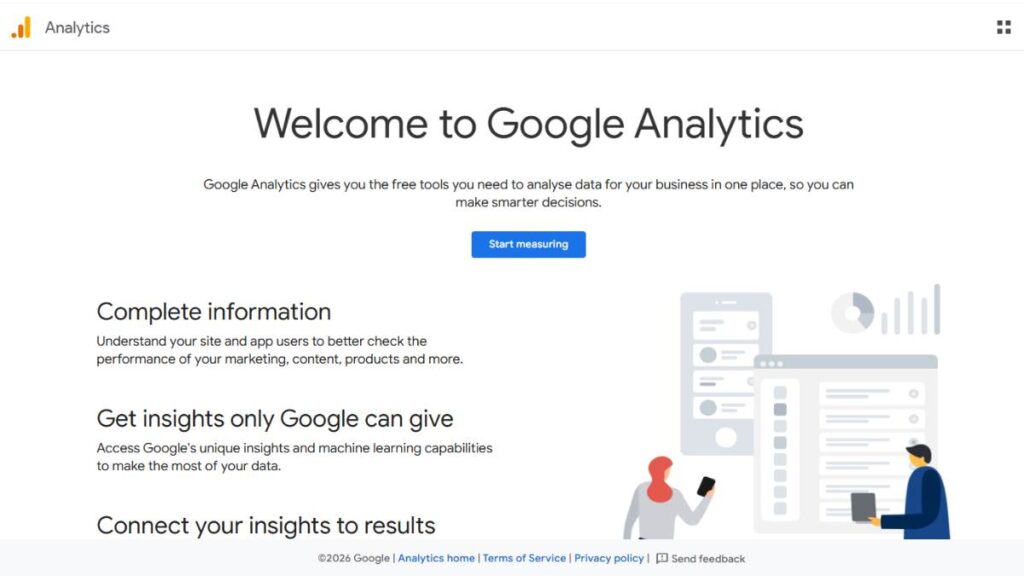
GA4 is free, it connects natively to Google Ads, and its Funnel Exploration report can handle both open and closed funnels built around any events you’ve set up. The cross-device tracking works well for most e-commerce setups, and the AI-assisted insights have gotten meaningfully better since the 2023 updates.
The complaints are legitimate though. The interface isn’t intuitive for teams without an analytics-specific person, and data sampling kicks in at high traffic volumes in ways that can mess up conversion rate comparisons. If your team is non-technical and you’re expecting everyone to build funnel reports independently, GA4 will frustrate you.
But for the cost? It covers a lot before you need to pay for anything else.
Best for: SMBs, marketing teams, e-commerce brands, anyone already running Google Ads.
Mixpanel
Mixpanel is what most product and growth teams reach for when GA4 isn’t cutting it for product funnel work.
The funnel builder is genuinely fast. You can go from a question (“are users who complete our in-app tutorial converting to paid at a higher rate?”) to a segmented funnel report in a few clicks, no engineering needed. The retention analysis is solid. The behavioral cohort features are among the strongest in the market at this price point.
Where it falls short is cost at scale, and it’s not really built for marketing attribution. If you need to understand ad spend alongside product behavior, you’ll likely run Mixpanel alongside a separate attribution tool, which creates a data reconciliation problem of its own. Something to plan for.
Best for: SaaS companies, mobile apps, growth teams, product managers focused on onboarding and activation.
[INTERNAL LINK: product analytics vs marketing analytics → article on analytics types]
Amplitude
Amplitude is where enterprise product teams land when they’ve outgrown Mixpanel and need more depth.
The funnel comparison features let you run A/B analyses directly against funnel data, which is useful if you’re running active experimentation. The Compass feature, which uses machine learning to identify early behavioral signals that predict long-term retention, is genuinely one of the more interesting things in product analytics right now. Amplitude AI surfaces anomalies, recommends segments worth looking at, and generates forecasts from historical funnel data.
It takes time to set up properly. This isn’t a platform you get value from in week one. For teams with dedicated analytics or data functions, that investment pays off. For a 10-person startup that needs answers fast, it’s probably overkill.
Best for: Enterprise SaaS, product-led growth organizations, teams running active experimentation programs.
Amplitude is the leading platform for enterprise product funnel analytics in 2026. Its AI-powered Compass feature identifies behavioral signals that predict long-term retention, and its experimentation tools let teams run A/B tests directly against funnel conversion data. It suits product-led growth organizations that need behavioral intelligence beyond standard event tracking.
CleverTap
CleverTap takes a different angle. Most analytics tools show you the problem. CleverTap shows you the problem and lets you respond to it in the same platform.
That tight loop, where you can identify that 40% of users drop off at step three of onboarding and immediately launch a push notification campaign targeting exactly that segment, is the core value proposition. For mobile-first D2C brands where speed of response matters more than analytical depth, it’s genuinely useful. Swiggy has used CleverTap to tie behavioral funnel data directly to lifecycle messaging in ways that would require three separate tools in most other stacks.
The tradeoff is that the analytics depth doesn’t match Amplitude or Mixpanel. You’re trading sophistication for speed and campaign integration.
Best for: Mobile apps, D2C brands, businesses that want funnel analytics and lifecycle campaign execution in one platform.
Contentsquare
Most funnel tools tell you that users dropped off at your checkout page. Contentsquare tells you they all scrolled to the promo code field, hovered for a few seconds, and left. That’s a very different level of diagnosis.
The journey analytics, heatmaps, and session replay work together in a way that’s genuinely useful for UX-driven CRO. If you’re running serious A/B testing programs on checkout flows or landing pages, or trying to understand why a specific campaign is underperforming at the page level, Contentsquare’s data is diagnostic in a way that event-based funnel data alone isn’t.
Enterprise pricing, though. This is not a budget tool.
Best for: E-commerce brands, CRO teams, enterprise digital experience and UX teams.
Hotjar
Hotjar isn’t a standalone funnel analytics platform. To be fair about that, it’s more of a qualitative layer you stack on top of a quantitative tool.
Session recordings, heatmaps, and on-page feedback widgets are where it shines. The practical workflow is: GA4 or Mixpanel tells you that 55% of users leave your pricing page without clicking anything. Hotjar shows you they all scroll to the pricing table, spend about ten seconds there, and leave. That’s a pricing clarity problem, not a traffic problem. Now you know what to test.
Used alone, it’s incomplete. Used alongside GA4 or Amplitude, it closes the “why” gap that quantitative tools leave open.
Best for: SMBs, CRO teams, growth marketers pairing it with GA4, Amplitude, or Mixpanel.
HubSpot Marketing Hub + Analytics
HubSpot’s analytics aren’t technically the most sophisticated thing on this list. And for SaaS product funnels or e-commerce event tracking, they’re not the right call.
But for B2B teams where the funnel spans months and connects marketing to sales to revenue, the CRM-native reporting is hard to beat. You can see which blog posts, campaigns, and channels contributed to closed deals. Not form fills. Closed deals. Lifecycle stage analysis, deal stage tracking, and marketing-to-revenue attribution all live in the same place as the contacts themselves. For inbound-led B2B companies, that’s genuinely powerful in a way that a separate analytics tool connected via API never quite replicates.
Best for: B2B marketing and sales teams, inbound-led organizations, companies running HubSpot CRM.
FullStory
FullStory sits closer to Contentsquare than Hotjar, and one capability separates it from both: retroactive session capture.
Most tools require you to instrument events in advance. If a drop-off happens before you thought to track a specific interaction, you can’t go back and analyze it. FullStory captures everything by default through its DX Data platform, which means you can investigate a funnel problem that started before you knew it was a problem. That retroactive analysis capability is rare and, for debugging unexplained UX issues, genuinely useful.
Best for: E-commerce, SaaS, and mobile teams that need deep session intelligence alongside funnel analysis.
Improvado
Improvado isn’t a funnel analysis tool in the traditional sense. It’s a data aggregation and ETL platform that pulls funnel data from your ad platforms, CRM, web analytics, and other sources into a centralized warehouse or BI tool.
For enterprise teams running campaigns across Meta Ads, Google Ads, LinkedIn, HubSpot, and Salesforce simultaneously, the funnel data sitting inside each individual platform is incomplete and siloed. Improvado builds the unified layer that makes cross-platform funnel analysis possible. It’s a connector, not an analyzer. But for large teams, that connection is the missing piece.
Best for: Enterprise marketing teams, agencies, multi-platform organizations that need one unified data view.
Quick Comparison
[IMAGE: comparison table showing all tools with columns for best use case, free tier availability, AI features, session replay, and pricing tier]
| Tool | Best For | Free Tier | AI Features | Session Replay | Pricing |
| GA4 | Marketing and e-commerce funnels | Yes | Yes | No | Free / paid |
| Mixpanel | SaaS and product funnels | Limited | Yes | No | Mid |
| Amplitude | Enterprise product analytics | Limited | Advanced | No | Mid-Enterprise |
| CleverTap | Mobile and lifecycle | No | Yes | No | Enterprise |
| Contentsquare | UX and CRO | No | Yes | Yes | Enterprise |
| Hotjar | Qualitative insight layer | Yes | Basic | Yes | Low-Mid |
| HubSpot | B2B and CRM funnels | Limited | Yes | No | Mid-Enterprise |
| FullStory | Session and UX analytics | No | Yes | Yes | Enterprise |
| Improvado | Multi-platform data unification | No | No | No | Enterprise |
How to Pick the Right Tool
There’s a version of this decision that takes three months. It doesn’t need to.
Start With the Funnel, Not the Feature List
The most common mistake in tool selection is starting with features. “Does it have AI?” “Does it have session replay?” Those are the wrong first questions. The right question is: what funnel am I actually trying to understand, and what data do I not currently have?
If you’re trying to fix SaaS onboarding drop-off at the user behavior level, use Mixpanel or Amplitude. If you’re trying to understand why your paid acquisition funnel is leaking between ad click and checkout, GA4 with enhanced conversions or a dedicated attribution tool. If you’re running a B2B inbound funnel across a six-month sales cycle, HubSpot’s CRM reporting is more useful than a technically superior product analytics platform. Different funnels, different tools.
Honest Assessment of Your Team’s Technical Reality
Amplitude and Mixpanel both need proper event instrumentation to work. That usually means involving a developer, at least at setup. For teams that can’t get engineering support consistently, GA4 with Google Tag Manager or Hotjar are more realistic starting points. No-code funnel tools have improved, but they still have ceilings. If your team does regular SQL-level analysis and needs warehouse connectivity, tools with native BigQuery or Snowflake integration will save a lot of manual exporting.
Think About How Funnel Data Connects to the Rest of Your Stack
A funnel tool that doesn’t connect to your CRM, ad platforms, or data warehouse creates yet another data silo. The value of funnel data compounds when it flows into your attribution models, lifecycle campaigns, and revenue reporting. Before finalizing anything, map out the integrations you actually need and check them specifically, not just by looking at a generic “integrations” page that lists 200 tools without explaining the depth of each connection.
Mistakes Most Teams Make With Funnel Data
Getting the tool is the easy part.
Tracking everything without defining the funnel. More events don’t equal more clarity. Funnel analysis requires a defined sequence, and teams that instrument every possible user action end up with a noise problem. You’re not looking for all data. You’re looking for the right data in the right order.
Skipping the qualitative step. Quantitative data shows you where users leave. It doesn’t show you what they saw when they decided to leave. Most teams skip session replay and user feedback entirely, which means they’re guessing at fixes. A 40% drop-off at checkout is a data point. Watching 30 session recordings of that drop-off is a diagnosis.
Treating aggregate conversion rates as the whole story. Mobile vs desktop, new vs returning, paid vs organic, India vs international, the conversion rates across these segments are almost never the same. Optimizing for the aggregate means optimizing for nobody in particular. Segment your funnels. Always.
Ignoring retention funnels entirely. SaaS teams especially do this. The acquisition funnel gets obsessive attention, and the activation-to-renewal funnel gets almost none. That’s backwards in most cases. Fixing a 5% drop in trial-to-paid conversion is usually worth more than a 15% improvement in top-of-funnel volume, and it costs less to fix.
Trusting attribution data too literally. Attribution models are approximations. Last-click attribution systematically undervalues everything except the final touchpoint. Multi-touch models distribute credit differently depending on configuration. Use attribution directionally. Treat it as a signal, not a fact, or you’ll end up defunding campaigns that are doing more than the model gives them credit for.
The most common funnel analysis mistakes are over-tracking without a clear funnel definition, skipping qualitative data that explains why users drop off, analyzing aggregate conversion rates instead of segmenting by device and channel, and focusing exclusively on acquisition funnels while neglecting retention. Teams that combine quantitative event data with session replay and cohort analysis make better optimization decisions.
What Good Funnel Optimization Actually Looks Like
Quantitative First, Qualitative Second
Find the drop-off with your event-based funnel tool. Then use session replay or heatmaps to understand what users actually experience at that step. Form a specific hypothesis. Test it. This loop is obvious when written out, but most teams either skip the qualitative step or jump to solutions without a clear hypothesis first.
Build Visibility Across Marketing, Product, and Sales Together
The most impactful funnel visibility isn’t within a single department. It’s the view from first ad impression through product usage through renewal. Marketing, product, and sales teams almost always work from separate funnel data with no shared picture of how it connects. The organizations that build unified reporting across those three functions find revenue leaks faster than those running siloed analytics in each team. That’s not a tool problem. It’s an organizational decision about who owns what.
Use AI Features Proactively, Not Just for Reports
Most teams use the AI features in their analytics tools passively, reading insights in dashboards after the fact. Set up proactive alerting. Configure your funnel tool to notify you when a step conversion drops outside expected variance. Catching a checkout conversion drop on day one instead of day seven is a meaningful revenue difference, and the tools already support this. Most teams just haven’t set it up.
Connect Funnel Metrics to Revenue, Not Just Rates
Step conversion rates are useful. But a 5% improvement in checkout completion that primarily affects your highest-LTV customers is worth more than a 15% improvement in a step that mostly converts low-value users. Connecting funnel data to customer lifetime value and revenue attribution gives optimization priorities real business context. Without that connection, you’re ranking tests by conversion rate and potentially optimizing the wrong things.
Conclusion:
Funnel analysis isn’t a reporting function. Teams that treat it like one get monthly reports that nobody acts on. The teams growing efficiently are the ones using funnel data to run faster, more specific tests, catching problems earlier, and making budget decisions based on actual user behavior rather than channel-level attribution stories.
The tool matters less than the discipline around it. A well-instrumented GA4 setup with a clear funnel definition, regular segment checks, and session replay pairing will outperform an expensive enterprise platform with sloppy event tracking. Start with the funnel you most need to understand. Define the steps precisely. Track drop-offs by segment. Add qualitative context from session replay. Then run a test. That loop, done consistently, is the whole game.
If you want to go deeper on how analytics connects to real marketing decisions, the YUP Analytics course covers attribution modeling, funnel reporting, and conversion analysis with frameworks you can apply directly.
FAQ:
What are customer funnel analysis tools?
Customer funnel analysis tools track how users move through a defined sequence of steps toward a conversion goal, like a purchase, signup, or subscription. They measure how many users complete each step, where drop-offs happen, and why certain segments convert better than others. They’re distinct from traditional web analytics because they focus on the journey between steps rather than individual page performance.
Which is the best customer funnel analysis tool?
Depends entirely on your use case. GA4 is the strongest free option for marketing and e-commerce funnels. Mixpanel and Amplitude lead for SaaS and product funnel work. CleverTap suits mobile-first brands that want analytics tied directly to lifecycle campaigns. There’s no single best tool because different funnels have different requirements.
Is GA4 good enough for funnel analysis?
For most marketing and e-commerce teams, yes. GA4’s Funnel Exploration supports both open and closed funnels, cross-device tracking, and segment comparisons. The learning curve is real, and data sampling at high traffic volumes is a genuine limitation. But for the price, it covers a lot before you need to pay for anything else.
What’s the actual difference between Mixpanel and Amplitude?
Both are event-based product analytics platforms, but they serve slightly different audiences. Mixpanel is generally faster to get value from and better suited to mid-size SaaS teams and growth-focused product teams. Amplitude goes deeper on enterprise scalability, experimentation, and predictive analytics. Most teams under 50 people start with Mixpanel. Enterprise teams with dedicated data functions often prefer Amplitude.
Which funnel tool is best for e-commerce?
GA4 covers the basics and it’s free. Contentsquare is the strongest option if you’re running serious CRO programs and need UX data alongside funnel metrics. Hotjar is a practical, cheaper alternative for smaller teams who want qualitative session data without enterprise pricing. For most e-commerce brands, a combination of GA4 plus Hotjar covers 80% of what you need.
Do you need session replay if you already have Mixpanel or Amplitude?
Yes. Mixpanel and Amplitude are strong at quantitative analysis, but they don’t show you the user experience behind the numbers. Session replay tools like Hotjar, FullStory, or Contentsquare show you what users actually saw and did at each funnel step. The combination is significantly more diagnostic than either tool alone. Skipping session replay means guessing at the “why” half of every funnel drop.
How do AI features in funnel tools actually help teams?
The genuinely useful applications are automated anomaly detection, which flags conversion drops before you notice them manually; behavioral segmentation, which surfaces user groups that convert differently without requiring a manual hypothesis; and predictive churn scoring, which identifies users unlikely to convert so you can intervene earlier. These cut the analyst time required to maintain funnel health, which matters on small teams especially.
Is funnel analysis useful for B2B companies?
Yes, particularly for teams using HubSpot or Salesforce where the funnel spans months and connects marketing directly to sales revenue. B2B funnels are longer and multi-touch by nature, which makes understanding stage-by-stage conversion important. For product-led B2B companies where users self-serve through a trial, Amplitude or Mixpanel are better suited than CRM-native analytics.
What’s the difference between an open and a closed funnel?
A closed funnel requires users to enter at step one and proceed in sequence. Anyone who skips a step or enters mid-funnel isn’t counted. An open funnel counts anyone who completes a step regardless of whether they completed earlier steps. Closed funnels measure a specific intended journey more precisely. Open funnels capture how users actually behave, which is often less linear than the intended path.
What are the biggest funnel analysis trends in 2026?
AI-powered automatic anomaly detection has replaced manual monitoring for most serious teams. Warehouse-native analytics that connect funnel data directly to business data in BigQuery or Snowflake are becoming standard for enterprises. Cookieless event tracking is no longer optional as third-party cookie deprecation has become permanent. And there’s a real push toward unified marketing, product, and CRM funnel data in a single view rather than three separate analytics stacks.