

Your team has spent three weeks redesigning the onboarding flow of a subscription app. The new version looks cleaner. Everyone in the room likes it. Then someone asks the question that stops the meeting. Is it actually better or just newer?
That’s the gap A/B testing in product management is there to close. Opinions, stakeholder preferences and even user interviews can point you in a direction. They can’t tell you which version performs better once real people use it. A/B testing, also called split testing, can. That said, it lets product teams show two versions of a product to randomly assigned users. They can measure what each group does.
This guide covers where tests fit, how to design one, which metrics matter, how to read the results and which tools are worth a look. The onboarding example keeps coming back. It shows the whole process in one place.
Table of Contents
What Is A/B Testing in Product Management?
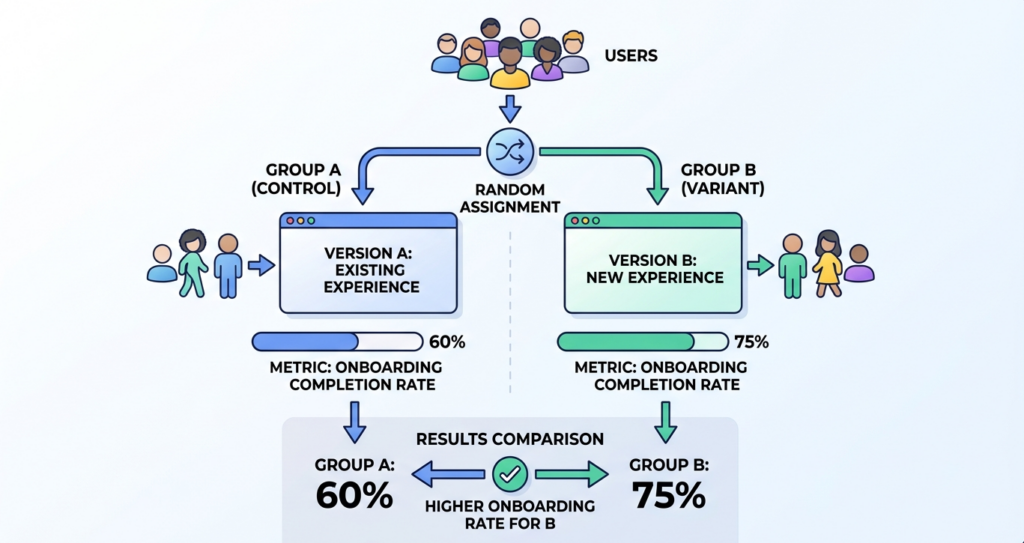
A/B testing is a controlled experiment. It lets you compare two versions of an experience by randomly splitting users between them and measuring a pre-chosen outcome. Version A is the current experience. Version B is the change you want to evaluate.
Each user is assigned to one version. They see only that version and are tracked against the same metric. Assignment is random, so the two groups should look alike at the start. That’s what lets you credit a difference in outcomes to the change itself, and not to who happened to see it.
Picture a fictional subscription app. One group of users gets the existing setup flow. Another gets a shorter one. You compare how many finish onboarding in each.
It also helps to know what A/B testing isn’t. Surveys and usability tests tell you what people say and where they struggle. An A/B test tells you what they actually do, under controlled conditions. You need both. One explains the why and the other shows the what.
Also Read: Is Product Management a Good Career in 2026? An Honest Answer
A/B testing is a controlled experiment that randomly assigns users to a control version and a variant. It then compares a pre-defined metric between them. It measures behavior, not opinion. That is why it complements surveys and usability testing instead of replacing them.
Key Terms Product Managers Should Know
- Control group and treatment group: The control group sees the current experience. The treatment group sees the change.
- Hypothesis and variant: A hypothesis is a testable prediction about what a change will do and why. A variant is the changed version under test.
- Primary metric and guardrail metric: The primary metric decides whether the test worked. Guardrails are measures that shouldn’t get worse, such as crash rate or refunds.
- Statistical significance and confidence interval: Significance asks whether a gap is larger than chance alone would usually produce. A confidence interval gives a plausible range for the true effect.
- Statistical power and minimum detectable effect (MDE): Power is a test’s ability to detect a real effect. The MDE is the smallest change worth detecting.
Why Do Product Managers Use A/B Testing?
A/B testing in product management gives teams a way to make data-driven decisions before a change reaches every user. It helps them validate assumptions, find friction and measure value, while keeping the cost of being wrong small.
- Validate assumptions early. A test shows whether users respond the way the team expects before the change becomes permanent.
- Improve onboarding and activation. Small flow changes can move how many new users reach their first moment of value. That is often the fastest way to improve your product’s retention.
- Find friction in important journeys. Comparing versions of a signup or checkout path shows where people stall.
- Measure whether a feature delivers. Shipping a feature and proving it works are two different things.
- Choose between alternatives. When two designs both sound reasonable, behavior breaks the tie and helps you optimize your product with evidence instead of debate.
- Learn from misses. In a 2012 KDD paper, Microsoft researchers reported that only about one third of the ideas they tested improved the metric they were meant to improve. Most ideas don’t work. A test tells you which ones.
When Should Product Managers Run an A/B Test?
Run an A/B test when you have a specific change, a measurable outcome and enough traffic to detect a difference in a reasonable time. If any of those is missing, other research methods will usually teach you more, faster. That’s where A/B testing in product management earns its keep. Frequent and measurable decisions with clear user-facing outcomes.
Common Product Decisions Worth Testing
Amplitude’s own quick guide suggests three starting points. Onboarding, a conversion moment such as a pricing page and validating a feature before a full rollout. Beyond those, the usual candidates are:
- Feature adoption and discoverability
- Navigation, page layouts and user flows, such as a product page on an e-commerce platform
- Pricing presentation and upgrade prompts, within business and legal limits
- Notifications and recommendations that affect user engagement and retention
The same logic works for conversion optimization on landing pages and marketing campaigns. It applies at several points in the product development process.
When A/B Testing May Not Be the Right Approach
- The product doesn’t have enough traffic to detect a meaningful difference in a reasonable period.
- The team is still working out what the user problem is.
- The change is needed for security, compliance, accessibility or a critical bug fix.
- Users affect each other, as in marketplaces or shared workspaces. So individual randomization breaks down.
In those cases, interviews, usability tests and prototypes help you confirm the problem first. A controlled experiment comes later, once there’s something specific to compare.
Types of Experiments Product Managers Should Understand
A/B testing in product management isn’t one technique. Different questions call for different testing methods. Picking the wrong one wastes traffic or, worse, produces a result that looks solid and isn’t.
A/B Testing
The classic format compares the existing experience with one alternative. It’s best when you test one change at a time. That’s because the result is easy to attribute.
A/B/n Testing
A/B/n testing compares a control against two or more versions. It’s handy when you want to test different onboarding lengths at once. More test variations need more traffic. Comparing many variants against one control calls for statistical corrections to avoid false positives.
Multivariate Testing
Multivariate testing varies several elements together. These include headline, image and button, to estimate each one’s effect and how they interact. It generally needs far more traffic than a simple A/B test.
Feature Experiments and Feature Flags
A feature flag controls who sees a feature. That makes gradual rollouts safer. It doesn’t prove the feature helped. Amplitude’s documentation draws the same line: use a plain flag to control exposure, and an experiment when you need a controlled comparison.
Sequential Testing and Multi-Armed Bandits
These aren’t interchangeable with a standard A/B test.
- Fixed-horizon testing: You plan a sample size or stopping point in advance and analyze once it’s reached.
- Sequential testing: Lets you check results along the way, using a procedure designed to account for repeated looks.
- Multi-armed bandits: Shift traffic toward better-performing options as data comes in, usually to reduce the cost of showing a weaker version.
How to Design and Run an A/B Test: A Step-by-Step Process
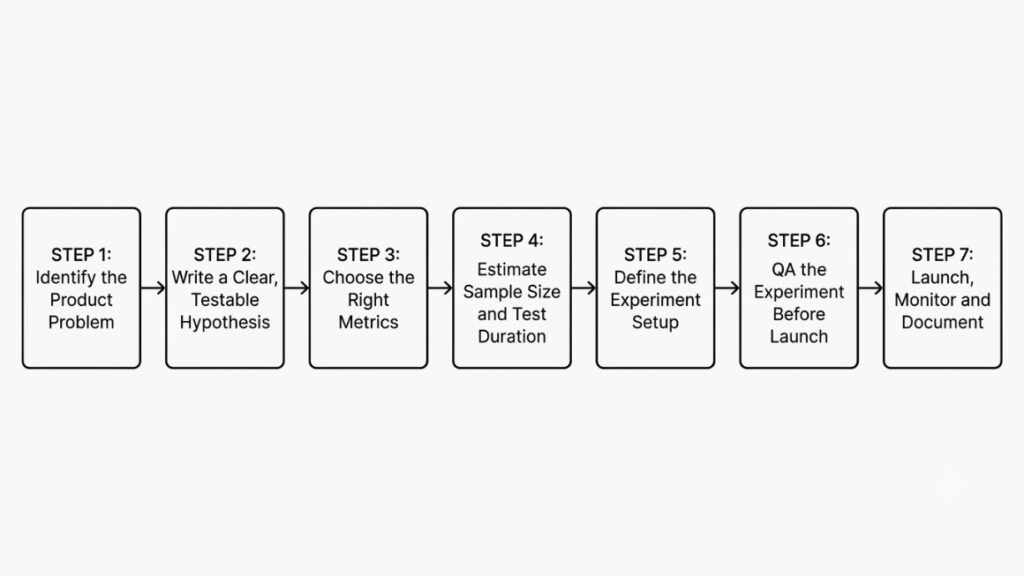
To run A/B testing in product management properly, define the problem, write a testable hypothesis, choose metrics, size the sample, set up the experiment, check it before launch, then monitor and document. Seven steps, in that order.
Step 1: Identify the Product Problem
Start with evidence, not a redesign idea. Look at funnel drop-offs in analytics, repeated themes in support tickets, interview notes and usability recordings. Then ask why fixing it matters to users and to the business. New users abandoning setup at step three is a problem. “The screen looks dated” isn’t.
Step 2: Write a Clear, Testable Hypothesis
Use this template: If we change X for audience Y, metric Z will improve because of reason R.
For the onboarding example: If new users get a shorter setup flow, more of them will complete setup because there are fewer steps between them and the product. Amplitude’s quick guide uses nearly the same format. Clear hypotheses force the team to name the metric and the reason before seeing data. The reason is what you still learn from when the test fails.
Step 3: Choose the Right Metrics
- Primary metric: The one outcome used to judge the hypothesis. Pick one. Two primary metrics means you’ve already decided to find a win somewhere.
- Secondary metrics: Extra measures that help explain user behavior.
- Guardrail metrics: Measures that shouldn’t deteriorate. These are crash rate, latency, refunds or customer satisfaction.
Be careful with click-through rate on its own. A more tempting button label can lift click-through while sending people to a screen that never converts.
Also Read: 15 Best Product Analytics Tools
Step 4: Estimate Sample Size and Test Duration
Four inputs drive the math. Your baseline conversion rate. The minimum detectable effect. The statistical power you want. The significance threshold. Add expected traffic and you get a duration, which you then round up to cover full usage cycles, since weekdays and weekends often behave differently.
There’s no universal number. Statsig’s docs tell teams to run a power analysis first because its output sets the target duration. Amplitude’s quick guide suggests a 50/50 split and at least two weeks as a starting point. Treat that as a default, not a rule.
Step 5: Define the Experiment Setup
Write down who’s eligible, the randomization unit (user, device or account), how traffic is split, which events you’ll track and who gets excluded, such as employees or bots. Decide how overlapping experiments are handled too, and keep the setup document short enough that a teammate can audit it in five minutes. LaunchDarkly, for instance, uses layers to stop experiments from sharing the same traffic.
Step 6: QA the Experiment Before Launch
Confirm that assignment works, both experiences render properly on every supported device and analytics events fire for each version. Check that the allocation ratio matches the plan. Then look for sample ratio mismatch (SRM), which means the observed split between groups differs from the intended one by more than chance would explain. Microsoft’s experimentation team requires every test to pass an SRM check before anyone reads the results.
Step 7: Launch, Monitor and Document
Once live, watch data quality, technical errors and guardrails on real-time dashboards. Resist the urge to stop the moment an early result looks favorable. Run the test for the planned duration, follow the analysis method you chose beforehand and document the decision, the numbers and what you learned.
A reliable A/B test follows seven steps: identify the problem, write a testable hypothesis, choose a primary metric with guardrails, calculate sample size and duration, set up randomization and tracking, QA the experiment including a sample ratio mismatch check, then monitor and decide using the plan written before launch.
How to Analyze A/B Test Results and Make a Decision?
To analyze A/B test results, compare the primary metric between control and variant, check whether the gap is larger than random variation would produce, confirm guardrails held, and only then decide. A positive number alone isn’t a decision.
Compare the Primary Metric Against the Control
Before you analyze the results, make sure the SRM check passed and that both groups were assigned at the same time and measured the same way. Then compare. Here’s a hypothetical onboarding result:
| Metric | Control | Variant |
| Users | 1,000 | 1,000 |
| Completed onboarding | 300 | 330 |
| Completion rate | 30% | 33% |
Variant B finished onboarding at 33% against 30% for the control. That’s 3 percentage points higher, or a 10% relative increase (3 divided by 30). Both numbers are true, and they tell different stories, so report both.
A gap in one sample isn’t proof, though. It could be a real effect, or it could be due to random chance. The difference alone doesn’t establish statistical significance or a lasting effect.
Understand Statistical Significance and Practical Impact
A p-value is the probability of seeing a difference at least this large if the two versions truly performed the same. That’s hypothesis testing in its simplest form: assume no difference, then ask how surprising the data would be. A confidence interval adds a plausible range for the true effect.
The American Statistical Association’s 2016 statement warned that a p-value doesn’t measure the probability a hypothesis is true, or the size or importance of a result. So a statistically significant result can still be too small to matter commercially. And a non-significant one doesn’t prove the versions are equal. It may just mean the test lacked the power to tell.
A statistically significant result means the observed difference would be unusual if the two versions were truly equal. It doesn’t show the effect is large, lasting or commercially worthwhile, and a non-significant result doesn’t prove the versions perform the same. Read the p-value alongside the effect size and confidence interval.
Check Guardrails and Segment Results Carefully
Look for trade-offs in retention, revenue, reliability and user experience. A shorter flow that lifts completion but cuts week-one retention isn’t a win.
Be skeptical of unplanned subgroups, too. Slice results enough ways and one segment will look impressive by luck. Treat those findings as ideas for the next test, not conclusions.
Decide What to Do Next
- Positive: A reliable, practically meaningful gain with acceptable guardrails may justify a staged rollout.
- Negative: The change hasn’t shown enough benefit, or it introduced unacceptable trade-offs.
- Inconclusive: The evidence can’t support a confident call either way.
Reading the numbers is only half of A/B testing in product management. The other half is acting on them, and the next section shows how each outcome plays out.
A/B Testing Example: Improving a Product’s Onboarding Flow
The Product Decision
Back to the fictional subscription app. The shorter onboarding flow produced a 33% completion rate against 30% for the control. Those figures are hypothetical, not a published case study, but the decision is a real one: ship, shelve or keep testing? It’s A/B testing in product management reduced to a single call.
What Happens If the Result Is Positive?
If the result meets the pre-defined statistical criteria, the gain is practically meaningful and the guardrails hold, a staged rollout is worth considering. Keep monitoring afterward. Small lifts can be worth a lot. A change tested at Bing, described by Ronny Kohavi in Harvard Business Review, raised revenue by 12%, worth over $100 million a year in the US.
What Happens If the Result Is Negative?
If the variant performs worse or creates unacceptable trade-offs, keep the existing experience and study why. A revised hypothesis may justify a second experiment.
What Happens If the Result Is Inconclusive?
Don’t assume the two flows are equal. Check the confidence interval, the sample actually reached and the quality of the setup. Then decide whether more data, another experiment or qualitative research is worth the cost. Sometimes the right move is a different test altogether.
A/B Testing Best Practices for Product Managers
Impactful A/B testing in product management is mostly discipline. These best practices work as a checklist before and after every experiment.
- Start with a real user problem. A random design tweak teaches little, even when it wins.
- Define the hypothesis and primary metric first. Choosing them after seeing results invites cherry-picking.
- Estimate sample size and set a stopping rule. Decide in advance when the test ends, then stick to it.
- Randomize consistently. A user should see the same version on every visit and never be exposed to both.
- Validate instrumentation. Broken tracking and sample ratio mismatch can quietly invalidate a test.
- Account for multiple comparisons and overlapping tests. More metrics, segments or concurrent experiments raise false-positive risk and interference.
- Cover usage cycles and watch for novelty effects. A fresh design can attract curiosity that fades within weeks.
- Document results, limits and decisions. A log of failed tests stops teams from repeating them.
- Use Bayesian or sequential methods only when you’ll follow their rules. Each framework has its own stopping and interpretation logic.
- Monitor long-term outcomes after rollout. Retention and revenue can drift from the short-term lift.
Most of this comes down to one habit: treat it as a process of testing and learning, not a hunt for winners.
Common A/B Testing Mistakes and How to Avoid Them
Most common pitfalls of A/B testing in product management enter early in the testing process, long before anyone looks at a dashboard. They’re process failures more than math failures.
| Mistake | How to avoid it |
| Stopping too early | Follow a pre-defined stopping rule or a valid sequential method. |
| Choosing the wrong metric | Connect the metric to the hypothesis and the intended product outcome. |
| Testing with too little traffic | Estimate the required sample size before launch. |
| Ignoring data quality | Validate event tracking and investigate sample ratio mismatch. |
| Declaring a winner from unplanned segments | Treat subgroup findings as exploratory unless they were planned. |
| Ignoring long-term effects | Monitor retention and relevant outcomes after rollout. |
Teams with a real culture of experimentation still make every one of these. The difference is that they catch them in review, not after launch.
Best A/B Testing Tools for Product Managers
The right tool for A/B testing in product management depends on your product, analytics stack, engineering capacity, experimentation needs and budget. There’s no universal best. Check each vendor’s documentation, because features vary by plan and change fast.
Tools to Compare
- Optimizely: Offers Web Experimentation for visual tests a marketing team can run without code deploys, and Feature Experimentation for SDK-based tests on backend logic.
- VWO: Built by Delhi-based Wingify. VWO Testing covers A/B, multivariate and split URL tests through a visual editor.
- Statsig: Combines experiments, feature flags and analytics. In May 2026, Amplitude took on the Statsig brand and customers, so check the roadmap before a long contract.
- Amplitude Experiment: Offers Web Experiment for no-code visual changes and Feature Experiment for flag-based tests, with results tied to Amplitude analytics.
- LaunchDarkly: Feature management first, with experimentation on top and layers for mutually exclusive tests. Availability depends on your plan.
- GrowthBook: An open-core platform that runs analysis in your own warehouse, such as BigQuery or Snowflake, with Bayesian and frequentist statistics.
How to Choose the Right Tool?
Compare these before you commit:
- Web, mobile and server-side support
- Analytics and data warehouse integrations
- Governance and statistical methods
- Privacy, consent and data access controls
- Implementation effort, team skills and current pricing
One more note: Google Optimize shut down on September 30, 2023, so any list still recommending it is out of date.
How A/B Testing Fits into Product Strategy
In modern product management, experiments help teams decide what to improve next. A/B testing in product management is how those calls get checked against real behavior. Connect your experiment roadmap to user problems, product objectives and success metrics, and the testing queue stops being random. A documented backlog also helps teams carry lessons across releases, which is what makes the iterative process of testing compound over time.
Not every roadmap item needs a test. Security fixes and compliance work usually don’t. And never bet a roadmap on one test.
A/B testing is a powerful tool for continuous improvement across the product development lifecycle, but it’s a tool for executing product strategy, not a substitute for one. [INTERNAL LINK: product strategy → product strategy framework guide] Evidence informs product decisions. It doesn’t replace judgment or customer research. [INTERNAL LINK: AI tools → AI tools for product management]
The Future of Product Experimentation
Here’s where A/B testing in product management may be heading. Treat these as developments to watch, not predictions:
- AI-assisted experiment creation and analysis, already visible in Optimizely’s Opal and Amplitude’s AI Assistant
- Wider use of server-side and full-stack experimentation
- Closer attention to experiment quality and statistical reliability
- Tighter links between feature flags, analytics and data warehouses
- Stricter expectations around privacy and consent
Conclusion
Good A/B testing in product management starts with a meaningful product problem and ends with a reasoned decision, not simply a winning variation. Begin with one focused hypothesis, one primary metric, sensible guardrails and a properly designed test. Trustworthy results depend on clean measurement, sound statistics and honest interpretation.
And remember what the exercise is for. The goal of A/B testing isn’t to prove an idea is right. It’s to make better product decisions based on evidence.
If you want to practice this on real product problems, YUP’s Product Management course is a good next step.
Frequently Asked Questions (FAQs)
What Is A/B Testing in Product Management, and Why Is It Useful?
A/B testing in product management compares a current experience with a changed one by randomly assigning users to each and measuring a chosen outcome. It’s useful because it shows what people do, not what they say, which lowers the risk of shipping changes that don’t help.
How Do Product Managers Plan and Run an A/B Test?
They start with a user problem, write a testable hypothesis, pick a primary metric and guardrails, estimate sample size, set up randomization and tracking, QA the experiment, then monitor it and decide using the plan written before launch.
When Should Product Managers Use A/B Testing?
Use A/B testing in product management when there’s a specific change, a measurable outcome and enough traffic. When you’re still discovering the problem, interviews and usability testing usually teach more, faster.
How Many Users Are Needed for an A/B Test?
It depends on your baseline conversion rate, the minimum detectable effect, statistical power, the significance threshold and expected traffic. Small expected effects need far more users than large ones, so run a power analysis before launch.
What Is the Difference Between A/B Testing and Multivariate Testing?
A/B testing compares two experiences that differ by one change. Multivariate testing varies several elements at once to estimate each one’s effect and their interactions, which usually requires considerably more traffic.
What Should a Product Manager Do If an A/B Test Is Inconclusive?
Don’t treat it as proof the versions are equal. Review the confidence interval, data quality and sample reached, then weigh the cost of more data against what you’d learn. Another test or qualitative research may be the better move.
Which Tools Can Product Managers Use for A/B Testing?
Options fall into three groups: dedicated experimentation platforms, feature management tools with testing built in, and open-source warehouse-based tools. Choose based on technical requirements, integrations, governance and budget, and verify current features with each vendor.