

Ad platforms have spent the last three years quietly breaking the way marketers measure performance. Cookie deprecation, iOS privacy prompts, and walled-garden reporting have all chipped away at the attribution data teams used to trust. If your dashboards still show clean, channel-by-channel ROAS numbers in 2026, you’re probably measuring less than you think you are.
This is exactly why MMM has moved from a Fortune 500 luxury to a mid-market necessity. It doesn’t rely on cookies, pixels, or device IDs. It uses spend, sales, and market data you already have, and it answers a question attribution alone can’t: what would happen to revenue if you moved money between channels?
By the end of this guide, you’ll know what an MMM actually measures, how it differs from the attribution model you’re probably already running, what data you need before you build one, and which tools make this accessible even if you don’t have a data science team on payroll.
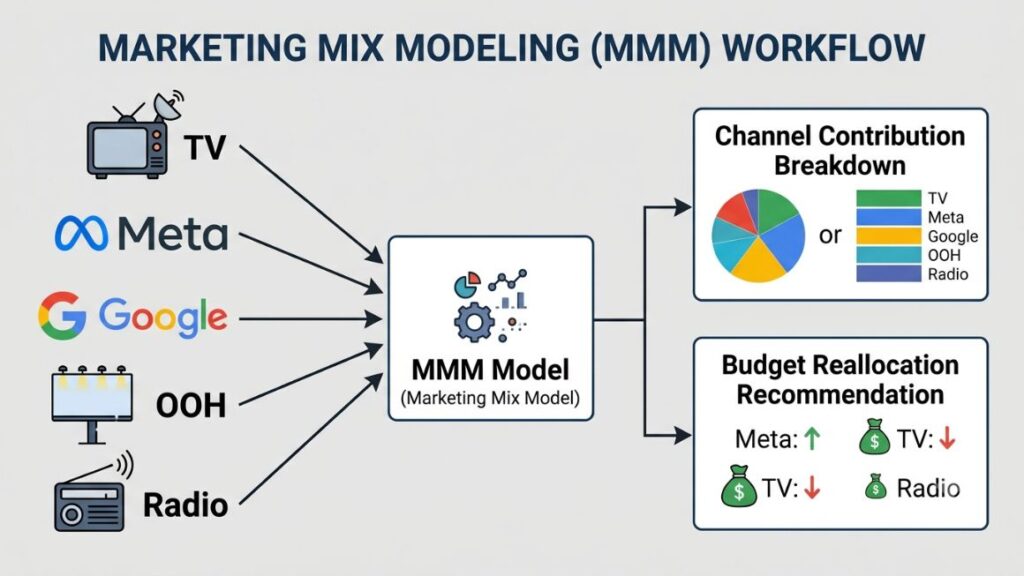
Table of Contents
What Is an MMM, Exactly?
Media Mix Models (MMM) use statistical regression to measure how much each marketing channel contributed to sales, based on historical spend and outcome data across weeks or months. No cookies, no tracking pixels, no user-level data required.
That last part is the whole point. An MMM doesn’t care whether a specific customer saw your Instagram ad before buying. It looks at aggregate patterns instead: in weeks when you spent more on TV, did sales go up? By how much, and after what kind of delay? Run that analysis across every channel simultaneously, and you get a picture of how your total media mix drives revenue.
Marketers have actually been doing this since the 1960s, originally to measure TV and print. What changed is the scale and the software. Where this used to require a six-figure engagement with a research firm and a wait of several months, platforms like Meridian (Google’s open-source MMM), Robyn (Meta’s open-source package), and paid tools like Recast now compress that timeline to weeks.
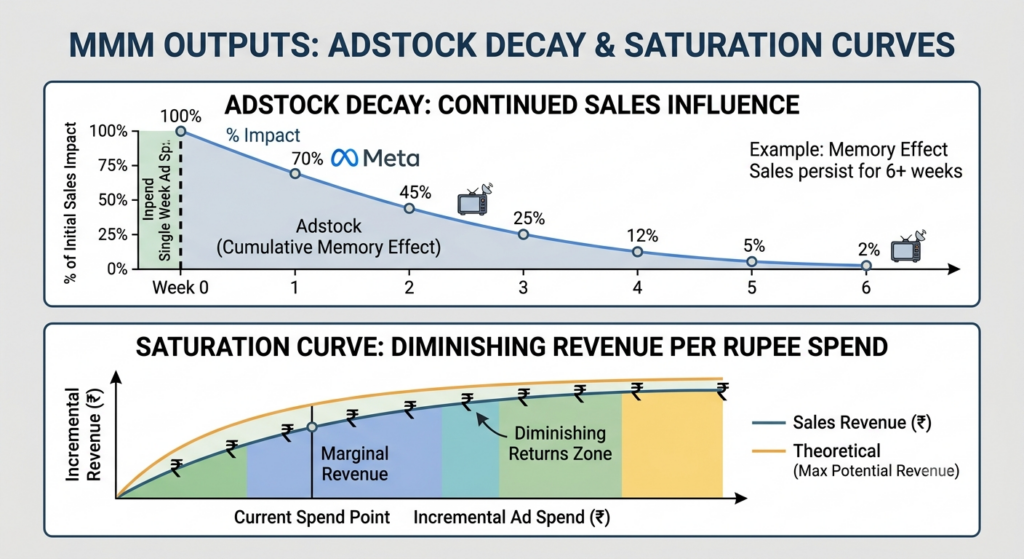
Here’s the part most explainers skip: an MMM produces a contribution curve, not a single number. It shows you the relationship between spend and revenue at every level, including where a channel starts to plateau. That curve is what tells you when to stop pouring budget into a channel that’s already saturated, and it’s the single most useful output of the whole exercise.
MMM uses aggregate, privacy-safe data such as weekly spend and sales figures to statistically estimate each channel’s contribution to revenue. Unlike attribution, it requires no user-level tracking, which makes it resilient to cookie deprecation and iOS 14.5+ tracking restrictions. The output is typically a contribution curve showing diminishing returns per channel, not a flat percentage.
How Does an MMM Actually Work?
Think of this next part as Media Mix Models Explained without the jargon: it’s really just about separating the sales your ads actually caused from the sales that would have happened anyway.
At its core, an MMM is a regression equation. Revenue in a given week is modeled as a function of your media spend across channels, plus a set of control variables that account for everything else influencing sales.
Those control variables matter more than people expect. Seasonality, pricing changes, competitor activity, weather, and even a public holiday can all move revenue independent of your ad spend. A good model separates that noise from the actual media effect. Skip this step and you’ll credit your ads for a sales spike that was really just Diwali.
Two concepts do most of the heavy lifting inside the model:
- Adstock (carryover effect): Advertising rarely converts the same week it runs. A TV ad or a YouTube pre-roll can influence a purchase two, three, even six weeks later. Adstock modeling captures that decay curve instead of assuming every impression works or disappears instantly.
- Saturation (diminishing returns): Every channel has a ceiling. Doubling your Google Search budget rarely doubles your search-driven revenue, because you eventually exhaust the pool of people actively searching for what you sell.
Once the model accounts for both, it can isolate each channel’s true incremental contribution and simulate what happens if you shift spend around. This is where the model earns its keep: it’s not just descriptive, it’s a planning tool.
boAt, the Indian audio and wearables brand, has talked publicly about running channel-level media efficiency reviews as it scaled across TV, digital, and offline retail simultaneously. That’s the exact scenario this kind of modeling was built for: a brand spending across formats that don’t share a common tracking layer.
MMM vs Attribution Models: What’s the Real Difference?
Most marketing teams already run some form of attribution, whether that’s last-click in Google Analytics or a multi-touch model in a platform like HubSpot. So it’s fair to ask why you’d need another measurement system on top of it.
This is the classic Media Mix Models vs Attribution Models confusion, and it trips up more teams than it should. Attribution tracks individual user journeys: it follows a specific person from ad click to conversion and assigns credit along that path. MMM does the opposite. It never looks at an individual user at all. It works entirely at the aggregate, market level.
That difference has real consequences. Attribution can’t see TV, radio, out-of-home, or word-of-mouth, because none of those generate a clickable, trackable touchpoint. MMM handles all of them the same way it handles digital, because it only needs spend and outcome data, not a click trail. Attribution also breaks down the moment a user clears cookies, switches devices, or opts out of tracking under Apple’s App Tracking Transparency framework. MMM never touches that data in the first place, so none of it applies.
The honest answer is that these aren’t competing systems, they’re complementary ones. Attribution is good at short-term, channel-level optimization: which Meta ad set converted better this week. MMM is good at strategic, cross-channel decisions: should you shift 15% of budget from paid social into connected TV next quarter. Teams that use both, and reconcile the two through a process called triangulation, end up with a far more complete measurement picture than either model gives alone.
Nykaa’s growth team has spoken about blending performance marketing dashboards with broader efficiency reviews as the brand expanded into offline stores, which is essentially attribution and MMM working the same problem from two different angles.
Attribution models track individual user journeys using cookies, pixels, and click data, making them precise at the channel level but blind to offline and privacy-restricted traffic. MMM uses aggregate spend and sales data instead, which lets it measure every channel including TV and out-of-home without relying on user tracking. Most mature marketing teams run both and reconcile the outputs through a process called triangulation.
Why MMM Matters More in 2026 Than Ever Before
For years, MMM was seen as the measurement approach for legacy advertisers still running TV campaigns. Digital-first brands leaned on attribution because it was cheap, fast, and granular. That gap has closed, and closed hard.
According to Google’s 2025 Meridian documentation, more than a third of app install and web conversion signals available to advertisers three years ago are no longer observable at the user level, due to a combination of iOS tracking restrictions, browser cookie deprecation, and platform-side data walls. Meta, Google, and TikTok each report performance inside their own black box, and none of them will tell you how a rupee spent on one platform affects demand for another.
That’s not a hypothetical problem anymore. It’s the everyday reality of running a multi-platform budget in 2026.
MMM sidesteps the entire mess because it was never built on tracking in the first place. It uses the same weekly spend and sales numbers marketers have always had access to, model or no model. That makes it one of the few measurement approaches that gets more relevant, not less, as privacy regulation tightens.
There’s a second reason it matters now: budget conversations have shifted. CFOs want to know marketing’s contribution to revenue in the same language they use for every other line item, and “our blended ROAS looks healthy” doesn’t answer that anymore. An MMM output, expressed as incremental revenue and marginal ROI per channel, translates directly into the kind of budget defense finance teams actually respect.
Mamaearth’s public commentary on shifting spend toward brand-building channels alongside performance channels reflects this exact tension: proving that upper-funnel investment pays off in a measurement environment where clicks alone don’t tell the story.
What Data Do You Need to Build an MMM?
You don’t need a data warehouse the size of Amazon’s to start. You need consistent, clean history, and enough of it to give the model real variation to learn from.
At minimum, plan to gather:
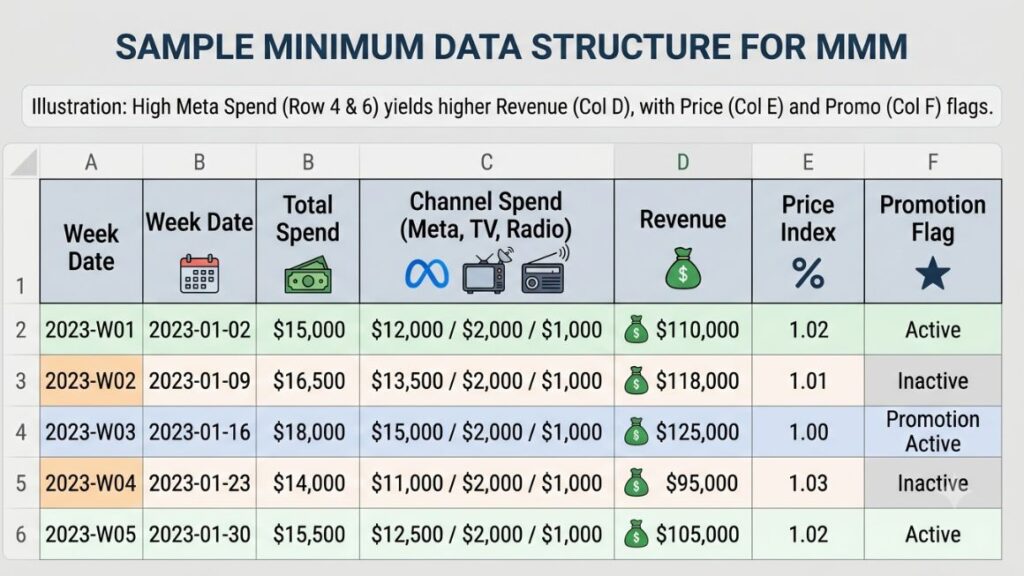
- Weekly or monthly media spend by channel, ideally 2-3 years of history for a stable model, though 18 months can work for a first pass
- Sales or revenue data at the same time granularity, from your CRM, ecommerce platform, or POS system
- Control variables: pricing changes, promotions, distribution expansion, seasonality, and major competitor moves
- External factors: macroeconomic indicators if relevant, weather for categories it affects, and any market-level disruptions like a competitor stockout or a regulatory change
Data granularity is where most first attempts go wrong. Daily data sounds more precise, but it often introduces more noise than signal, since day-of-week effects and reporting lag get exaggerated. Weekly aggregation is the sweet spot for most consumer brands, and it’s what Google’s Meridian and Meta’s Robyn both default to.
One honest limitation worth flagging here: if your brand is under 18 months old, or if you’ve never run more than two or three channels at meaningful spend, you likely don’t have enough variation in the data for a reliable model yet. In that case, a lighter-weight geo-lift test or incrementality experiment will teach you more per rupee spent than a full model will.
How to Build an MMM: Step by Step
You have two real paths here: build it yourself using an open-source package, or bring in a platform or agency that runs the modeling for you. Either way, the process follows the same core sequence.
- Audit and consolidate your data. Pull spend by channel, revenue, and control variables into a single weekly time series, going back at least 18 months and ideally 2-3 years.
- Choose your modeling approach. Google’s Meridian and Meta’s Robyn are both free, open-source, and Bayesian, meaning they let you incorporate prior business knowledge into the model rather than treating it as a black box. Paid platforms like Recast or Prescient AI handle this step for you if your team doesn’t have someone comfortable in R or Python.
- Set priors and constraints. This is the step that separates a useful model from a misleading one. If you know from a past geo-lift test that your TV ROI sits between 1.5x and 3x, feed that range into the model instead of letting it guess blind.
- Run the model and validate it. Check the model’s predicted sales against actual historical sales. If it can’t reconstruct the past accurately, it has no business forecasting the future.
- Extract channel contributions and response curves. This is your real deliverable: which channels are driving incremental revenue, where each one saturates, and where you’re likely underinvesting.
- Run budget reallocation scenarios. Simulate moving 10-20% of spend from a saturated channel into an underused one, and compare the model’s projected revenue impact before you touch a single real rupee.
- Validate with a real-world test. Before committing a full quarter’s budget shift, run a smaller geo-lift or holdout test to confirm the model’s recommendation holds up outside the simulation.
- Refresh the model quarterly. Consumer behavior, competitive activity, and platform algorithms all shift. A model built in January is stale by July if you don’t feed it new data.
Zepto’s rapid channel expansion during its quick-commerce growth phase is a useful reference case here. A brand adding new channels and new cities simultaneously needs exactly this kind of scenario simulation before committing budget at scale, because trial and error at that speed gets expensive fast.
Common Mistakes Marketers Make With MMM
Honestly, most MMM failures aren’t statistical, they’re organizational. The math is usually fine. The way teams use the output is where things go wrong.
The most common one: treating the model’s first output as gospel instead of a hypothesis to test. A model built on 18 months of data during a period when you barely touched connected TV has almost nothing useful to say about connected TV. Feed it more data or run a targeted experiment before making a big call based on a thin signal.
A second mistake is skipping validation entirely. Teams get excited about the contribution numbers and jump straight to reallocating budget, without first checking whether the model can even reproduce known historical results. If it can’t explain last year, it can’t be trusted to predict next year.
A third one shows up constantly with newer brands: expecting MMM to replace attribution rather than complement it. It won’t tell you which specific ad creative underperformed this week. That’s not the job. Keep attribution running for tactical, week-to-week decisions and let MMM guide the quarterly and annual budget conversation instead.
Best MMM Tools and Platforms in 2026
The tooling landscape has genuinely opened up over the last two years, and you no longer need a six-figure agency retainer to get a first working model.
- Google Meridian: Open-source, Bayesian, built and maintained by Google, and designed to integrate with Google Ads and Analytics data structures out of the box.
- Meta Robyn: Open-source and R-based, built by Meta’s marketing science team, popular with teams that already have some data science capability in-house.
- Recast: A paid, managed platform aimed at mid-market and enterprise brands that want ongoing model maintenance without hiring a dedicated data scientist.
- Prescient AI: Positions itself around daily-refreshed incrementality and mix modeling, aimed at ecommerce brands wanting faster iteration than a quarterly refresh cycle.
For most mid-market teams, the realistic starting point is Robyn or Meridian paired with a freelance data analyst or a small internal analytics function, moving to a paid platform once the budget under management justifies the spend.
The most widely used MMM tools in 2026 split into free open-source options, Google Meridian and Meta Robyn, and paid managed platforms like Recast and Prescient AI. Open-source tools suit teams with in-house analytics capability, while managed platforms suit teams that want ongoing model maintenance without hiring a dedicated data scientist.
From what we’ve seen with YUP’s Marketing Analytics course learners, the biggest barrier isn’t the modeling itself, it’s getting spend and revenue data into one clean, consistent weekly file in the first place. Solve that problem before you pick a tool.
Getting This Right Starts With Better Data Habits
Media Mix Models aren’t a silver bullet, and no serious practitioner will tell you otherwise. What they give you is a way to see your full channel mix, including the offline and privacy-restricted parts attribution can’t touch, and a framework for making budget decisions that survive a CFO’s scrutiny.
Start smaller than you think you need to. Get 18 months of clean spend and revenue data into one file, run it through Meridian or Robyn, and validate the output against something you already know to be true before you touch a single rupee of real budget.
If measurement and attribution are the part of your job that keeps eating your week, YUP’s Marketing Analytics course walks through MMM, attribution, and incrementality testing with the same practical, no-fluff approach as this guide. Or if you’d rather get shorter, tactical breakdowns like this one straight to your inbox, the Crystal Clear Newsletter covers exactly this kind of measurement topic every week.
Frequently Asked Questions
What is an MMM in simple terms?
It’s a statistical model that estimates how much revenue each of your marketing channels generated, using historical spend and sales data instead of user-level tracking. It works even for channels like TV and out-of-home that don’t produce a clickable trail.
Is choosing between MMM and attribution really an either-or decision?
No. Attribution is better for short-term, channel-level optimization, while MMM is better for quarterly and annual budget planning across the full channel mix. Most mature teams run both and reconcile the results through triangulation rather than picking one.
How much data do I need to build an MMM?
Aim for at least 18 months of weekly spend and revenue data, though 2-3 years produces a more stable model. Brands younger than 18 months or running only one or two channels usually don’t have enough variation yet.
Can a small or mid-market brand actually use MMM, or is it only for enterprise advertisers?
Small and mid-market brands can absolutely use it now, largely thanks to free open-source tools like Google Meridian and Meta Robyn. The barrier used to be cost and timeline; both have dropped significantly since 2023.
Is MMM more accurate than attribution?
Neither is more accurate in an absolute sense, they measure different things. Attribution is more precise at the individual touchpoint level, while MMM is more accurate at estimating the true incremental, market-wide impact of each channel, including offline ones attribution can’t see at all.
What is adstock and why does it matter in an MMM?
Adstock models the carryover effect of advertising, the fact that an ad’s influence on a purchase can show up weeks after it actually ran. Ignoring it means crediting the wrong week entirely for a sale that a much earlier ad actually caused.
How often should I refresh my MMM?
Quarterly is the standard refresh cycle for most brands, since consumer behavior, competitive activity, and platform performance all shift meaningfully over three months. Refresh sooner if you launch a new channel or make a major pricing change.
Do I need a data scientist on my team to run an MMM?
Not necessarily. Open-source tools like Robyn require some comfort with R, but paid platforms like Recast or Prescient AI handle the modeling for you. A freelance analyst or a small internal analytics hire is often enough to get started.
What’s the biggest limitation of an MMM?
It works at the aggregate level, so it can’t tell you which specific ad creative or audience segment underperformed. It also needs enough historical data and channel variation to produce a reliable read, which rules it out for very new or single-channel brands.
Why isn’t my MMM output matching what my attribution dashboard shows?
That’s expected, not a bug. The two models measure different things using different data, so some divergence is normal. Large, consistent gaps usually point to a control variable the MMM is missing, like a promotion or distribution change that attribution never had to account for.