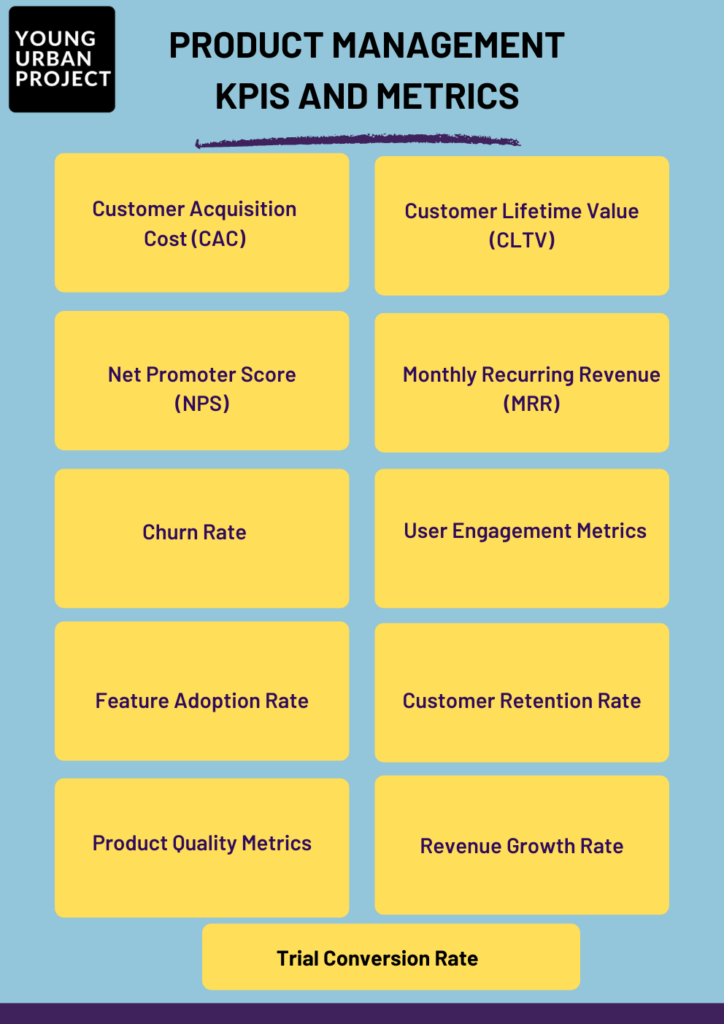
Product management is a multifaceted discipline that requires a strategic approach to ensure product success. Key Performance Indicators (KPIs) and metrics are vital for measuring product performance, making informed decisions, and achieving long-term objectives. This comprehensive guide will explore essential product management KPIs and metrics that every product manager should be familiar with to drive success.
Understanding Product Management KPIs and Metrics

KPIs and metrics are quantitative measures used to evaluate the performance of a product, its team, and its strategies. By tracking these indicators, product managers can identify areas for improvement, optimize processes, and ensure alignment with business goals.
1. Customer Acquisition Cost (CAC)
Customer Acquisition Cost (CAC) measures the total cost of acquiring a new customer. This metric is crucial for understanding the efficiency of marketing and sales efforts. To calculate CAC, divide the total marketing and sales expenses by the number of new customers acquired during a specific period.

A lower CAC indicates a more cost-effective customer acquisition strategy, which is essential for sustainable growth.
2. Customer Lifetime Value (CLTV/LTV)
Customer Lifetime Value (CLTV or LTV) estimates the total revenue a business can expect from a single customer account throughout its relationship. This metric helps product managers understand the long-term value of customers and make informed decisions about customer retention and acquisition strategies.

Balancing CLTV and CAC is vital for maintaining profitability and ensuring that customer acquisition costs do not outweigh customer revenue.
3. Net Promoter Score (NPS)
Net Promoter Score (NPS) measures customer satisfaction and loyalty by asking customers how likely they are to recommend the product to others. NPS is calculated by subtracting the percentage of detractors (those who score 0-6) from the percentage of promoters (those who score 9-10).

A high NPS indicates strong customer satisfaction and can predict future growth through word-of-mouth referrals.
4. Monthly Recurring Revenue (MRR)
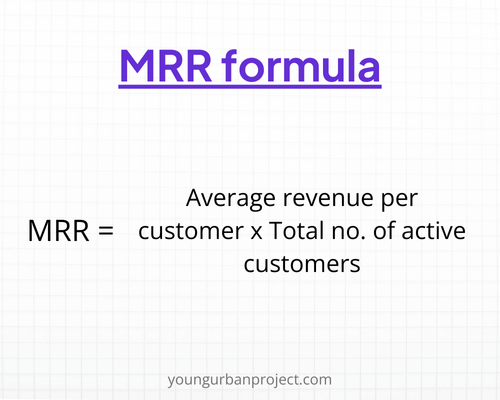
Monthly Recurring Revenue (MRR) is a critical metric for subscription-based businesses. MRR measures the predictable revenue generated each month from subscription services. Tracking MRR helps product managers understand the company’s financial health and forecast future revenue.

Increasing MRR indicates successful customer retention and expansion strategies.
5. Churn Rate
Churn Rate measures the percentage of customers who discontinue their subscription or stop using the product over a specific period. A high churn rate can indicate issues with product satisfaction or market fit.

Reducing the churn rate is crucial for maintaining steady growth and maximizing CLTV.
6. User Engagement Metrics
User engagement metrics provide insights into how users interact with the product. Key user engagement metrics include:
- Daily Active Users (DAU): Number of unique users who engage with the product daily.
- Monthly Active Users (MAU): Number of unique users who engage with the product monthly.
- Session Duration: Average time users spend on the product per session.
- Pages per Session: Average number of pages viewed during a session.
High user engagement indicates that the product is valuable and engaging to users, leading to increased retention and growth.
7. Feature Adoption Rate
Feature Adoption Rate measures how frequently new features or updates are used by customers. This metric helps product managers assess the effectiveness of product improvements and prioritize future development.

A high adoption rate indicates that new features are well-received and add value to the product.
8. Customer Retention Rate
Customer Retention Rate measures the percentage of customers who continue to use the product over a specific period. High retention rates indicate customer satisfaction and loyalty.

Improving customer retention is essential for sustainable growth and profitability.
9. Product Quality Metrics
Product quality metrics assess the reliability and performance of the product. Key product quality metrics include:
- Bug Frequency: Number of bugs reported over a specific period.
- Release Stability: Number of incidents or issues following a new release.
- Customer Support Tickets: Number of support tickets related to product issues.
Maintaining high product quality is critical for customer satisfaction and reducing churn.
10. Revenue Growth Rate
Revenue Growth Rate measures the increase in revenue over a specific period. This metric indicates the overall financial health and growth potential of the product.

Consistent revenue growth is a positive indicator of product success and market demand.
Implementing KPIs and Metrics for Product Success
Implementing product Management KPIs and metrics effectively requires a strategic approach. Here are some best practices for product managers:
- Align KPIs with Business Goals: Ensure that KPIs are aligned with the overall business objectives to drive meaningful outcomes.
- Set Realistic Targets: Establish achievable targets for each KPI to maintain motivation and track progress.
- Use Data-Driven Insights: Leverage data analytics tools to gather accurate and actionable insights.
- Regularly Review and Adjust: Continuously monitor KPIs and make adjustments based on performance and market changes.
- Communicate with Stakeholders: Keep stakeholders informed about KPI progress and involve them in decision-making.
11. Trial Conversion Rate: Key to Measuring Product Success
Understanding Trial Conversion Rate
Trial Conversion Rate measures the percentage of users who convert from a free trial to a paid subscription. This metric is essential for assessing the effectiveness of your trial period and the product’s ability to demonstrate value quickly.
Importance of Trial Conversion Rate
A high trial conversion rate indicates that users find the product valuable and are willing to pay for continued use. This metric helps product managers identify areas for improvement in onboarding, user experience, and feature set.
How to Calculate Trial Conversion Rate
Formula: Trial Conversion Rate=Number of Trial Users Who Convert to PaidTotal Number of Trial Users×100\text{Trial Conversion Rate} = \frac{\text{Number of Trial Users Who Convert to Paid}}{\text{Total Number of Trial Users}} \times 100Trial Conversion Rate=Total Number of Trial UsersNumber of Trial Users Who Convert to Paid×100
For example, if 1000 users sign up for a free trial and 200 of them convert to paid subscriptions, the trial conversion rate would be 20%.
Strategies to Improve Trial Conversion Rate
- Optimize Onboarding: Ensure that new users understand how to use the product effectively from the start. A smooth onboarding process can significantly impact conversion rates.
- Highlight Key Features: Make sure trial users are aware of the product’s most valuable features and how they can benefit from them.
- Offer Personalized Support: Provide personalized assistance to trial users through live chat, tutorials, or webinars to address their needs and questions.
- Gather User Feedback: Collect feedback from trial users to identify pain points and areas for improvement.
- Use Email Campaigns: Send targeted email campaigns to engage trial users and encourage them to convert to paid subscriptions.
Conclusion
Understanding and tracking essential product management KPIs and metrics is crucial for driving product success. By focusing on key indicators such as Customer Acquisition Cost, Customer Lifetime Value, Net Promoter Score, Monthly Recurring Revenue, Churn Rate, User Engagement Metrics, Feature Adoption Rate, Customer Retention Rate, Product Quality Metrics, and Revenue Growth Rate, product managers can make informed decisions, optimize strategies, and achieve long-term objectives.
Remember, the key to effective product management lies in leveraging data-driven insights, aligning KPIs with business goals, and continuously improving based on performance metrics. Implement these best practices to ensure your product’s success and maintain a competitive edge in the market.

